
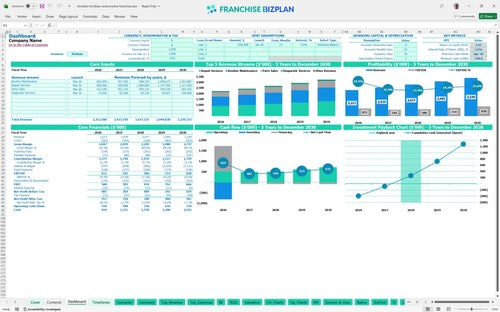
All-in-one Dashboard
Core inputs and core outputs


The franchise unit financial model template includes a full suite of interactive tabs for revenue modeling, CAPEX planning, 5-year projections, and scenario analysis.
Core inputs and core outputs
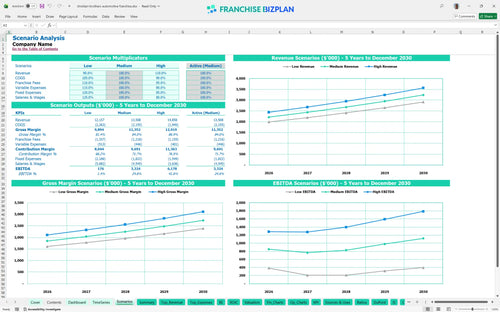
Three scenario analysis
Presentation ready
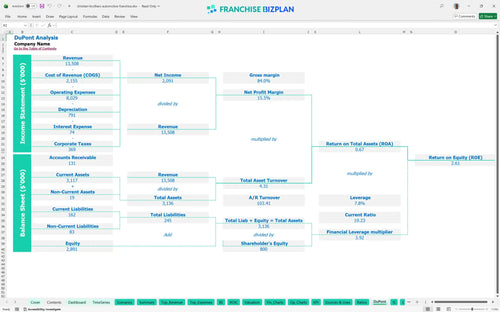
DuPont analysis
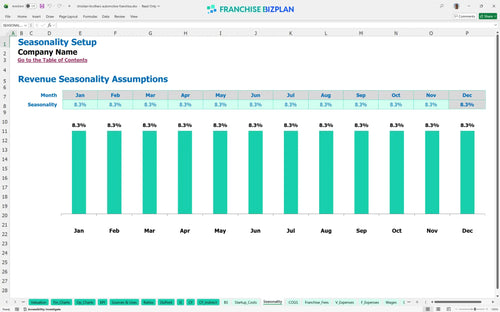
Researched revenue assumptions
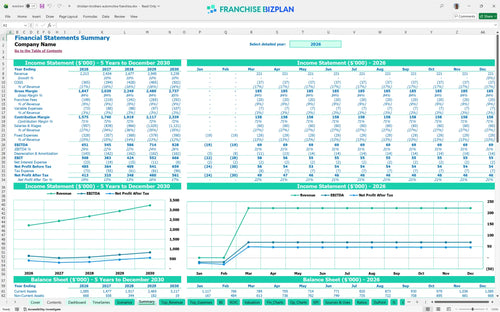
Lender-friendly financial outputs
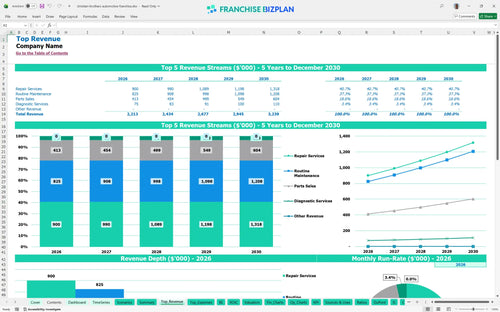
Revenue stream detailed view
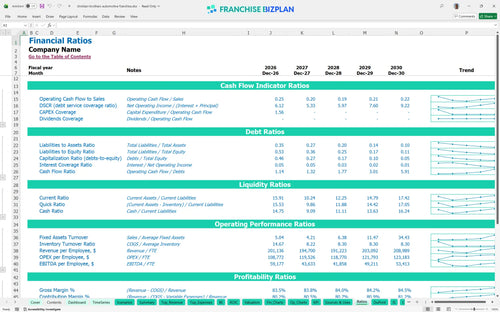
Performance metrics benchmark
We built this franchise unit financial model using our own research into the automotive repair sector. Key assumptions, including the $2.2M Year 1 revenue and the $810,000 initial capital outlay, are pre-populated but fully editable to match your specific territory. This model gives you a data-driven starting point to evaluate the 'Nice Difference' business philosophy without the guesswork.
Based on the $2,213,000 Year 1 revenue, this unit is profitable almost immediately. While EBITDA is $651,000 in the first year, it dips to $545,000 in Year 2 as you scale from 5 to 5.5 technicians to handle growth. This franchise profitability analysis shows a healthy trajectory, reaching $828,000 in EBITDA by Year 5 as your team hits peak efficiency. Using an auto repair shop profitability analysis spreadsheet is the best way to track this climb.
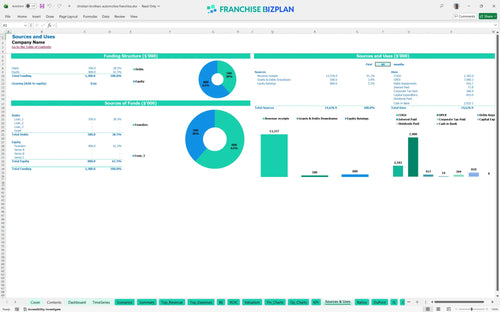
You will need $810,000 in capital to get the doors open and the lifts moving. This franchise investment analysis covers the $135,000 franchise fee and $250,000 in leasehold improvements for a premium boutique facility. Capital expenditure planning for automotive service facilities is critical because equipment like diagnostic tools ($80,000) and lifts ($150,000) are major upfront hits. Plus, you need to account for the $70,000 shuttle fleet to maintain the guest experience.
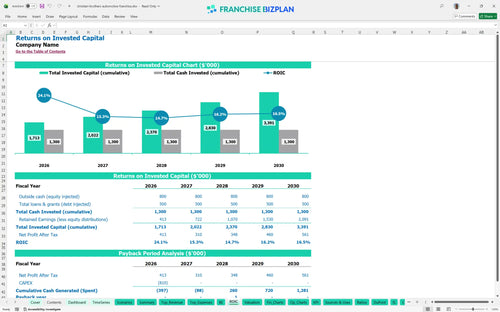
The automotive franchise ROI for this concept is driven by high average tickets and consistent demand. You are looking at a 3-year payback period and an Internal Rate of Return (IRR) of 5.63%. While the ROE of 2.61 might seem modest, it reflects a stable, asset-heavy business in a high-growth corridor. Evaluating franchise investment returns for auto repair requires looking at the Year 5 cash flow, which is significantly higher than the ramp-up years.
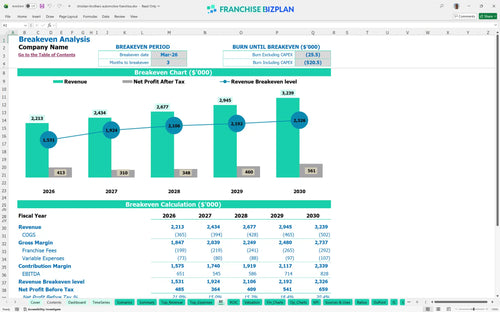
The break-even point occurs in March 2026, just three months after the unit launches. This is defintely fast for a brick-and-mortar business, but it relies on hitting your $1.15M combined maintenance and repair targets. Small business financial modeling shows that your $15,000 monthly rent is your biggest fixed hurdle. Estimating recurring revenue for automotive service centers is easier when you factor in the 10% annual growth from local family referrals.
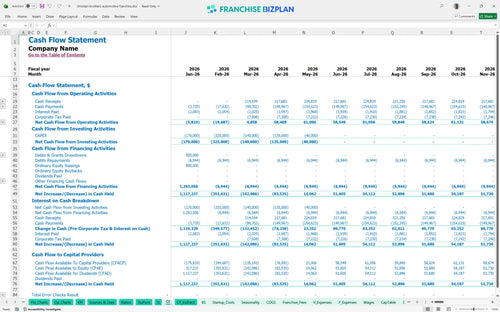
Your lowest cash point hits in April 2026 at $540,000. This follows the heavy CAPEX phase and the initial three months of operations where revenue is still scaling. Budgeting for high-growth corridor franchise locations means keeping a realy tight grip on your working capital during this window. If opening takes 60 days longer than planned, that $540,000 buffer becomes your most important asset.
Financial forecasting for new auto repair franchises must account for volatility in parts pricing and labor availability. In a High scenario, where you capture more diagnostic services ($75k base), your Year 1 margin expands significantly. Conversely, a Low scenario with 15% higher labor costs could push your payback period into Year 4. What this estimate hides is the impact of local marketing execution on your daily car count.
This franchise financial model template is built in Excel to give you total control over your numbers. It features pre-filled formulas and editable assumptions, so you can swap out local labor rates or rent costs without breaking the logic. Honestly, a model is only as good as its flexibility, and this one lets you stress-test every variable from technician wages to parts margins. It is the bridge between a generic spreadsheet and a real-world auto repair franchise business plan.

Success in the automotive sector requires looking past the first year of trading. This auto service franchise financial projection provides a detailed 5-year outlook, mapping your journey from a $2.2M opening year to a $3.2M mature operation. By integrating operating expense forecasting, you can see exactly how your margins shift as you add Master Technicians and scale your shuttle fleet. Long-term planning is the only way to stay ahead of the curve in a high-growth corridor.

We built this model to handle the specific financial weights of a major automotive brand. It includes dedicated inputs for the 6% royalty and 3% marketing fund contributions, ensuring you see the net cash left after the franchisor takes their cut. This automotive franchise royalty and fee structure analysis helps you understand the 'real' cost of brand support. Here's the quick math: at $2.2M in sales, you are sending nearly $200k back to corporate before you even pay the light bill.

Knowing your 'all-in' number is the first step to sleeping better at night. This tool breaks down automotive franchise startup costs, from the $135,000 franchise fee to the $150,000 for automotive lifts. By learning how to calculate startup costs for a car repair franchise correctly, you avoid the common trap of under-capitalization. The model identifies the exact sales volume needed to cover your $15,000 monthly rent and fixed overhead.

Don't guess what your labor or parts costs should be; use the built-in unit economics to stay grounded. This model uses researched data to set benchmarks for technician salaries and shop supplies, helping you spot margin leaks early. Franchise unit economic performance tracking is about comparing your shop to the top-tier operators in the Nashville metropolitan area. If your parts COGS (cost of goods sold) is way above 14.5%, you know exactly where to start digging.


Simply purchase and download the financial model template, then access it instantly using Microsoft Excel or Google Sheets. No installation or technical expertise required-just open and start working.

Enter your business-specific numbers, including revenue projections, costs, and investment details. The pre-built formulas will automatically calculate financial insights, saving you time and effort.

Leverage the investor-ready format to confidently showcase your financial projections to banks, franchise representatives, or investors. Impress stakeholders with clear, data-driven insights and professional reports.

Leverage the investor-ready format to confidently present your projections to banks, franchise representatives, or investors.