
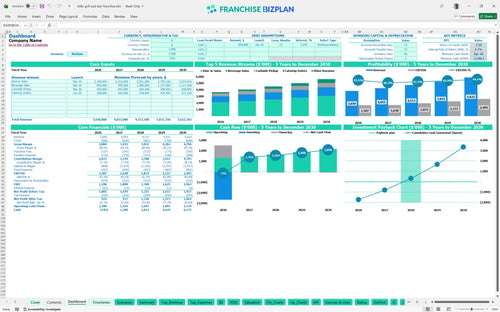
All-in-one Dashboard
Core inputs and core outputs


This restaurant franchise financial model template for excel provides a step-by-step franchise unit business plan guide with pre-populated data for revenue, labor, and CAPEX.
Core inputs and core outputs
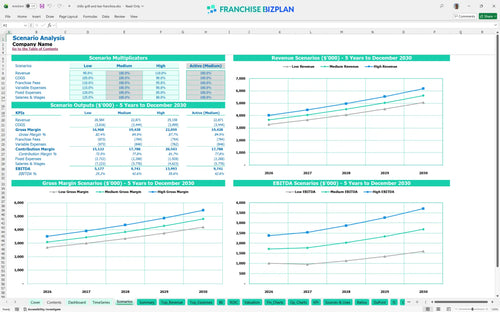
Three scenario analysis
Presentation ready
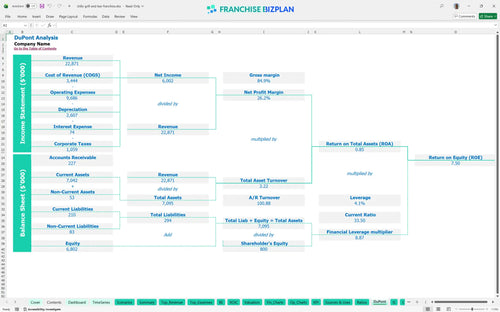
DuPont analysis
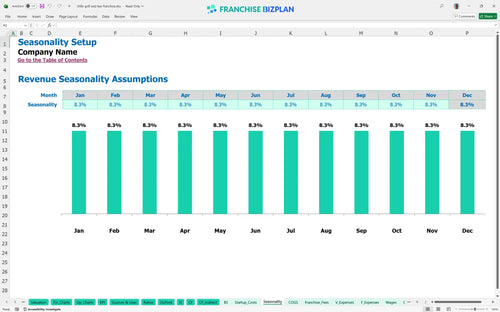
Researched revenue assumptions
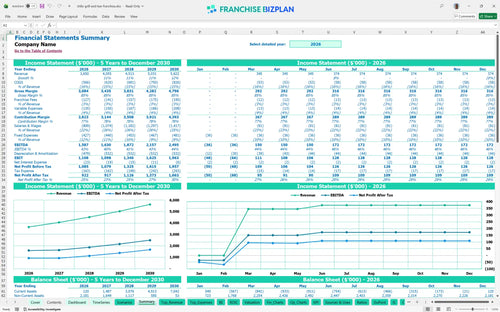
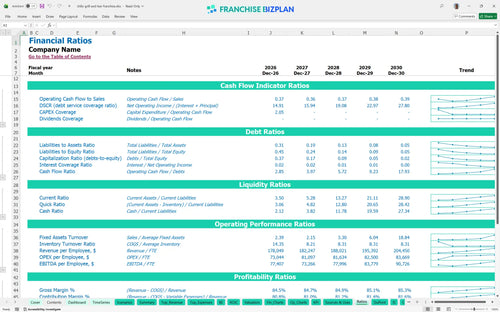
Lender-friendly financial outputs
Revenue stream detailed view
Performance metrics benchmark
Based on our research, the unit reaches profitability in March 2026, just three months after launch. With a year-one EBITDA of $1,587,000, the model accounts for food costs, the 1.25% royalty, and $25,000 monthly rent to determine the net profit trajectory. Speed to profit depends on hitting your $1.4 million dine-in sales target early. Early wins in beverage sales can significantly pull forward your profit timeline.
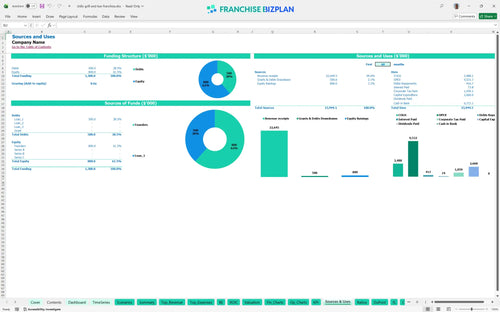
The total capital expenditure budget for this unit is approximately $2.66 million. This restaurant franchise startup budget spreadsheet allocates the bulk of funds to leasehold improvements and kitchen equipment to meet brand standards. You will also need to account for a $60,000 franchise fee and $300,000 for HVAC systems. A healthy cash buffer is included to handle the ramp-up phase before the March break-even.
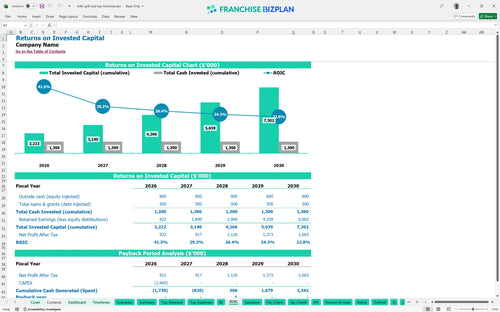
The franchise ROI projection shows an Internal Rate of Return (IRR) of 4.67% and a Return on Equity (ROE) of 7.5%. The model indicates a 3-year payback period, meaning you recoup your initial investment by the end of the third year of operations. This restaurant franchise unit investment analysis assumes steady growth in catering and curbside pickup to supplement dine-in revenue. Long-term value is built through consistent 10% year-over-year revenue growth.
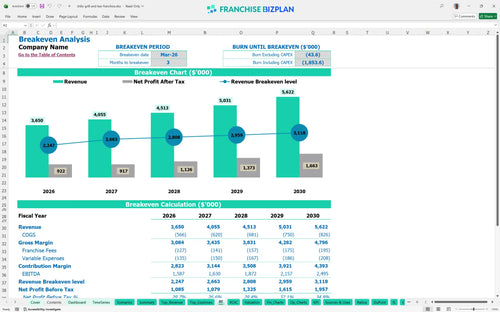
The unit hits its break-even point in March 2026, driven by a combination of $1.4 million in annual dine-in sales and $600,000 in beverage sales. Fixed costs, led by the $25,000 monthly rent and $95,000 general manager salary, require high daily traffic to cover. Your break-even is most sensitive to labor productivity and food ingredient costs, which start at 14%. Keeping a tight grip on variable expenses is the fastest way to stabilize the unit.
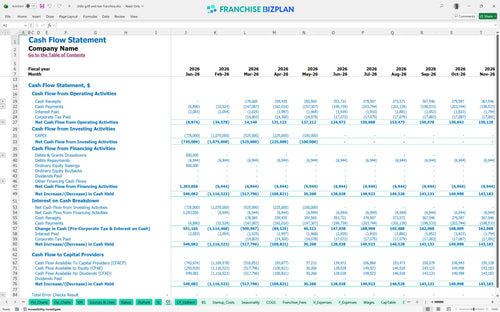
The lowest cash point occurs in April 2026, with a minimum cash balance of -$1,186,000. This indicates you need a robust financing plan or cash reserve to cover the gap between construction, equipment purchases, and the initial three months of trading. This restaurant franchise cash flow forecast highlights the importance of timing your $1.2 million leasehold payments. Proper cash management during the build-out phase prevents mid-project stalls.
The model allows you to toggle between Low, Medium, and High scenarios to see how a 10% dip in revenue affects your 3-year payback. In the High case, aggressive local marketing for catering orders ($200,000 in year one) can significantly boost your year-1 EBITDA of $1,587,000. Scenarios help you understand the financial feasibility study for restaurant franchise operations under various market conditions. Planning for the downside ensures you stay solvent during slow months.
This restaurant franchise operating expense template provides the data-driven foundation you need to secure financing and sign your lease. By mapping out your $2.66 million investment and 5-year revenue growth, you can move forward with confidence in your restaurant franchise profitability projection. Success in this model relies on maintaining brand standards while keeping a sharp eye on local labor and food costs. Use this tool to drive your month-to-month operational decisions.
Finance: update unit break-even and payback model by Friday
This restaurant franchise financial model is built in Excel to give you total control over your unit-level planning. You can adjust pre-filled formulas and editable assumptions to match your specific territory, whether you are looking at a high-traffic retail district or a suburban corridor. It serves as a restaurant financial forecasting excel tool that simplifies complex projections for your restaurant franchise unit business plan template.

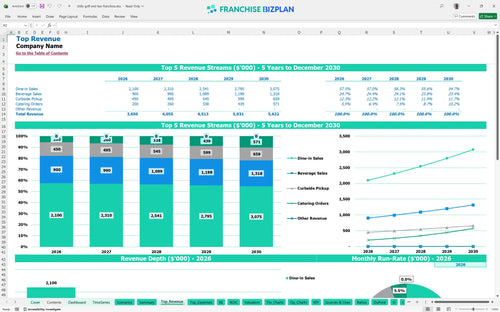
Planning for the long term is essential when scaling from one unit to a small chain. This model provides a detailed 5-year outlook, showing revenue growing from $3.65 million in year one to over $5.62 million by year five. It functions as a restaurant EBITDA calculator, helping you track how earnings before interest, taxes, depreciation, and amortization scale as your operations mature. This is the defintely the clearest way to visualize your five-year growth trajectory.

Operating a major brand requires precise tracking of your ongoing obligations to the franchisor. Our model captures the $60,000 initial franchise fee and calculates the ongoing 1.25% royalty and 2.22% marketing fund contributions. Understanding these 'off-the-top' costs is vital for calculating your true store-level margin and net cash flow. Every dollar sent to corporate must be balanced by high-volume throughput and efficient service.

Getting the doors open requires a significant capital outlay, and this restaurant startup cost breakdown helps you map every dollar. With leasehold improvements at $1.2 million and kitchen equipment at $500,000, your total initial investment is substantial. The model includes a break-even point calculation to show exactly what sales volume you need to cover your $25,000 monthly rent and variable costs. Knowing your floor is just as important as knowing your ceiling.

We have integrated real-world food cost percentage analysis into the model to ensure your projections stay grounded. Food ingredients start at 14% of sales in year one, providing a benchmark to measure your kitchen efficiency against. By comparing your labor and occupancy costs to these standards, you can identify margin leaks before they impact your bottom line. Use these benchmarks to sanity-check your local operating assumptions.


Simply purchase and download the financial model template, then access it instantly using Microsoft Excel or Google Sheets. No installation or technical expertise required-just open and start working.

Enter your business-specific numbers, including revenue projections, costs, and investment details. The pre-built formulas will automatically calculate financial insights, saving you time and effort.

Leverage the investor-ready format to confidently showcase your financial projections to banks, franchise representatives, or investors. Impress stakeholders with clear, data-driven insights and professional reports.

Leverage the investor-ready format to confidently present your projections to banks, franchise representatives, or investors.