
All-in-one Dashboard
Core inputs and core outputs


This detailed financial model for quick-service restaurant startup provides a complete roadmap from initial investment to long-term cash flow stability.
Core inputs and core outputs
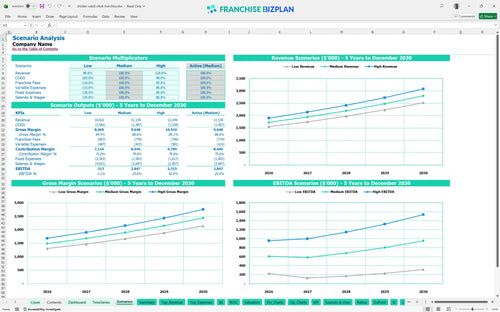
Three scenario analysis
Presentation ready
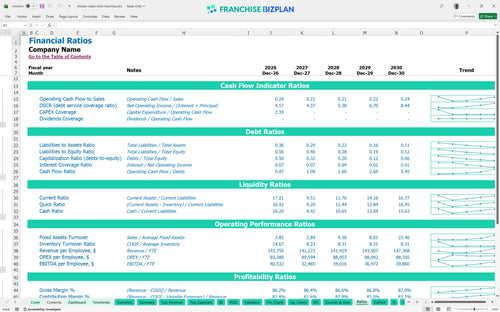
DuPont analysis
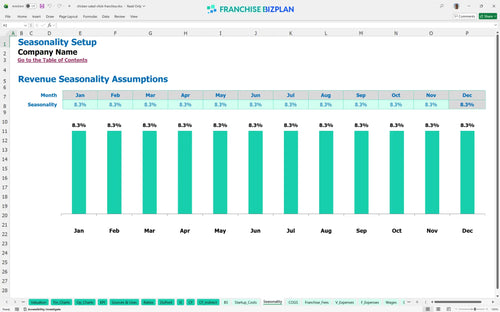
Researched revenue assumptions
Lender-friendly financial outputs
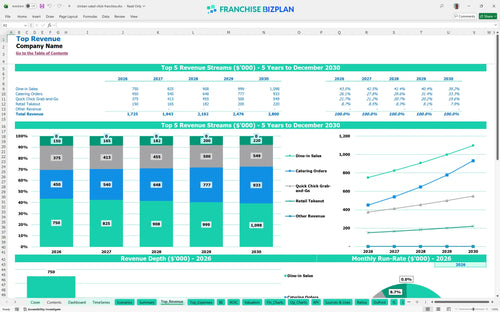
Revenue stream detailed view
Performance metrics benchmark
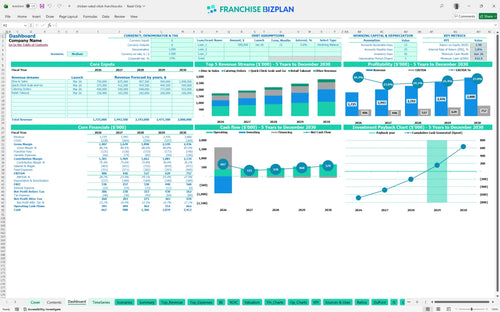
The unit reaches profitability quickly, showing an EBITDA of $486,000 in the first year. By year five, optimized operations and scaling revenue drive EBITDA to $757,000, assuming you manage the 11.2% food cost target effectively. Net profit grows steadily as you leverage fixed costs like the $20,000 monthly rent against higher sales volumes.
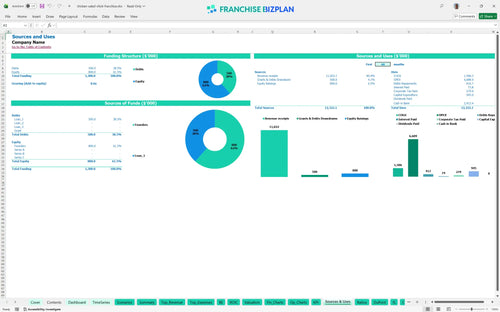
Launching this unit requires a total initial investment of $945,000 to cover all startup essentials in the US market. This includes the $50,000 franchise fee and $400,000 for leasehold improvements, which are the primary drivers of your initial cash outlay. A financial feasibility study for new franchise locations is critical to ensure your $423,000 minimum cash reserve remains intact during the ramp-up.
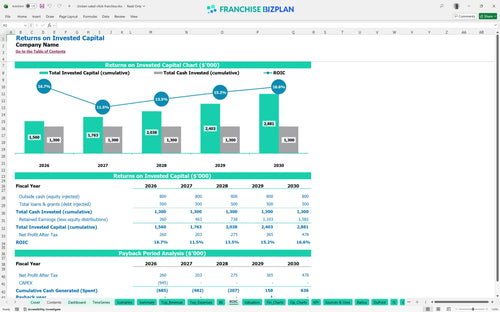
The franchise ROI calculation shows a 4-year payback period on the initial $945,000 investment. With an Internal Rate of Return (IRR) of 3.79% and a Return on Equity (ROE) of 1.98, the model demonstrates a stable, long-term wealth-building vehicle. Your average net margin is protected by keeping variable expenses like payment processing at a steady 2.3%.
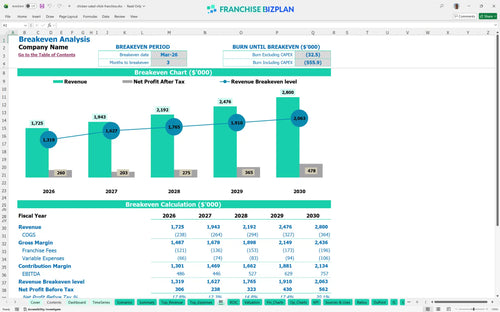
The unit hits its monthly break-even point in March 2026, just 3 months after the launch date. This rapid transition to positive territory depends on hitting the $1.72M year-one revenue target through a mix of dine-in and grab-and-go sales. Managing the $30,000 monthly fixed cost base is the most critical lever for maintaining this timeline.
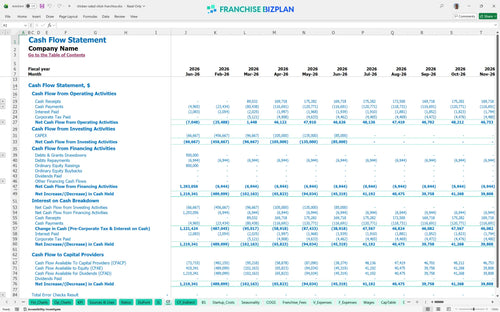
The lowest cash point occurs in June 2026, with a minimum cash balance of $423,000. This provides a healthy buffer, but you must monitor the timing of the $220,000 kitchen equipment payments to avoid liquidity pinches. A monthly operating budget template for food franchises helps track these outflows against the $150,000 monthly average revenue.
The high-growth scenario focuses on how to forecast restaurant sales for a new franchise unit by increasing catering and retail takeout. If revenue drops 10% in a low-case scenario, the 4-year payback period defintely extends, and the $423,000 cash floor becomes much tighter. Year-1 margins remain sensitive to the 7% combined royalty and marketing fee burden.
This franchise investment analysis and ROI projection tool provides the clarity needed to sign a multi-unit deal or a single-store lease. By mapping out the restaurant franchise business model and cash flow forecast, you can move forward with a data-driven plan. The math is simple: control your prime costs and the EBITDA will follow.
Finance: update unit break-even and payback model by Friday.
This franchise unit financial model is a flexible Excel tool designed for high-stakes decision-making. It features pre-filled formulas and editable assumptions, allowing you to adjust the restaurant franchise business plan to fit your specific territory, local labor rates, and real estate costs without starting from scratch.

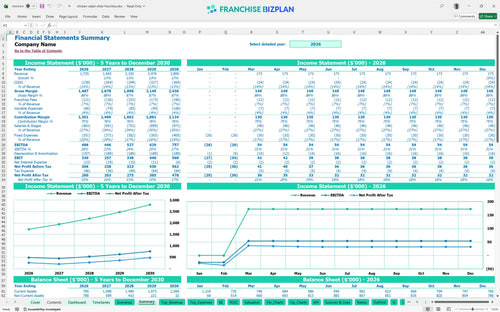
Success in the fast-casual space requires looking beyond the first year of operations. Our fast-casual restaurant financial projection provides a detailed 60-month outlook on revenue, costs, and cash flow, helping you visualize how the unit scales from a $1.72M opening year to a mature $2.8M operation by year five.

The model accurately tracks the franchise royalty fee structure, including the 5% royalty and 2% marketing fund contributions that impact your store-level margin. By automating these calculations, the franchise unit economics spreadsheet ensures you see the net cash available after all brand-level obligations are met.

We simplify how to calculate startup costs for a fast-casual franchise by aggregating leasehold improvements, equipment, and fees into a clear investment schedule. The built-in break-even analysis for restaurants shows exactly when your monthly volume covers both fixed rent and variable food costs.

This Excel template for restaurant franchise financial planning includes researched benchmarks for food costs and labor to help you sanity-check your budget. Comparing your 12% food ingredient cost against industry standards ensures your restaurant franchise profitability spreadsheet template remains realistic and achievable.


Simply purchase and download the financial model template, then access it instantly using Microsoft Excel or Google Sheets. No installation or technical expertise required-just open and start working.

Enter your business-specific numbers, including revenue projections, costs, and investment details. The pre-built formulas will automatically calculate financial insights, saving you time and effort.

Leverage the investor-ready format to confidently showcase your financial projections to banks, franchise representatives, or investors. Impress stakeholders with clear, data-driven insights and professional reports.

Leverage the investor-ready format to confidently present your projections to banks, franchise representatives, or investors.