
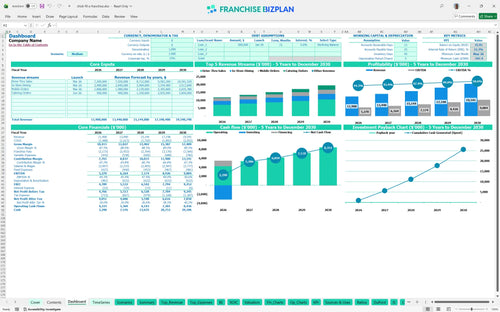
All-in-one Dashboard
Core inputs and core outputs


This financial forecasting tool for quick-service restaurant operators includes a complete set of pro forma statements, automated CAPEX schedules, and detailed labor modules tailored for high-volume units.
Core inputs and core outputs
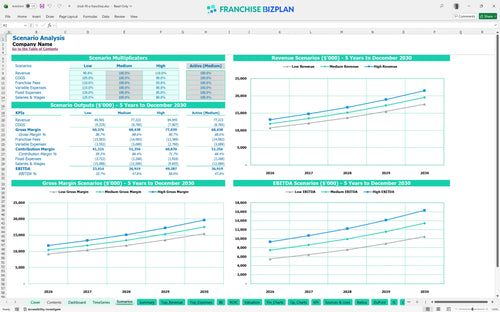
Three scenario analysis
Presentation ready
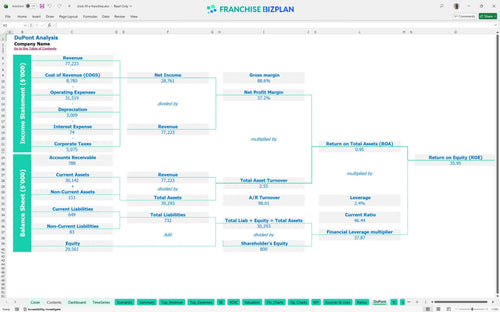
DuPont analysis
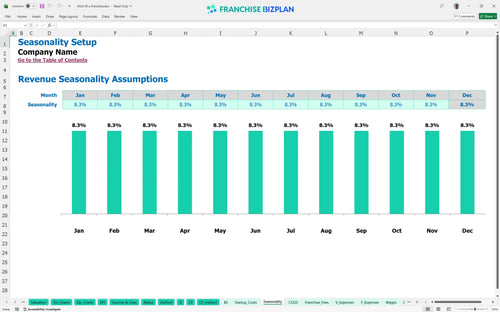
Researched revenue assumptions
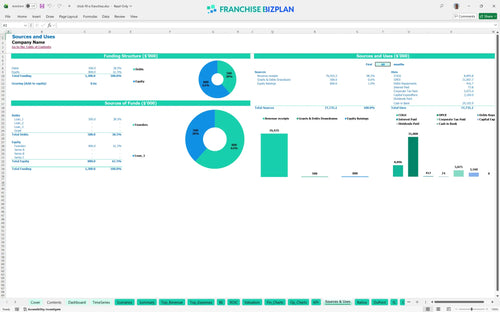
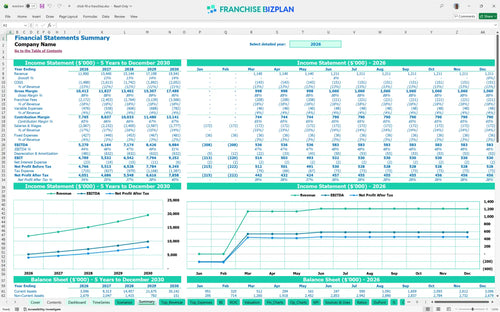
Lender-friendly financial outputs
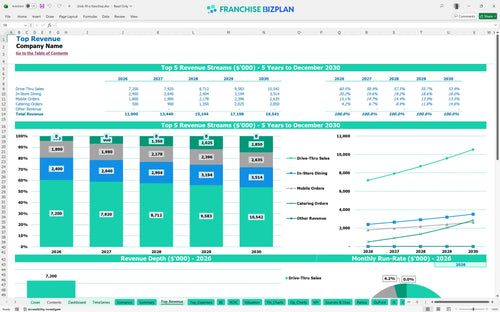
Revenue stream detailed view
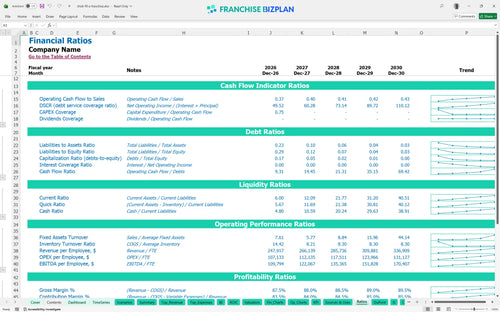
Performance metrics benchmark
We built this franchise unit financial model using extensive research into high-volume chicken concepts to ensure the data is actionable. Key assumptions like the $11.9M year-one revenue and the 15% royalty structure are pre-populated but remain fully editable to fit your specific Nashville or urban site. This tool provides a credible framework for estimating profitability for high-volume franchise locations without the guesswork.
This unit hits the ground running with a positive EBITDA of $5.27M in its first year of operation. Because the revenue is so high, the model shows immediate operational profitability even after accounting for the 18.25% combined royalty and marketing fees. You will see net margins improve as food costs drop from 10.5% to 8.5% over five years. High-volume throughput is the engine that drives this rapid profit realization.
You need $3,160,000 in total capital expenditure planning to get this flagship location off the ground. This covers the $1.2M in leasehold improvements and $850k for high-capacity drive-thru lanes essential for urban speed. The model also accounts for $450k in kitchen equipment and a $10k initial franchise fee. Having this much skin in the game is why your site selection and throughput strategy must be perfect from day one.
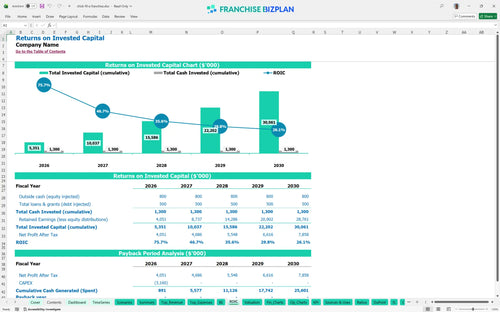
The return on investment calculation shows an IRR of 15.34% and a Return on Equity of 35.95%. While the annual profits are massive, the large $3.16M initial investment means the full payback of original capital occurs after year five. This is a long-term wealth-building play rather than a quick cash flip. Investors should focus on the $9.8M annual EBITDA potential by year five as the primary value driver for ROI for urban flagship franchise locations.
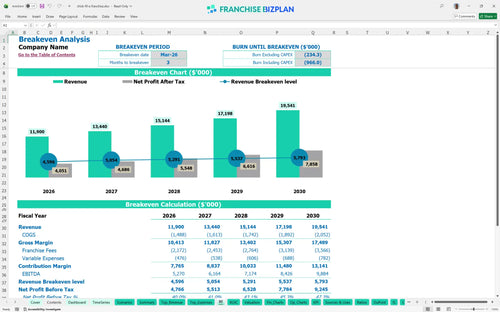
The restaurant franchise revenue projection spreadsheet indicates a break-even date of March 2026, just three months after launch. This aggressive timeline is possible because the model assumes you hit high volume almost immediately through the dual-lane drive-thru. The biggest threat to this timeline is labor mismanagement, as you are starting with a massive 40-person team. You defintely need to monitor the $25,000 monthly rent to ensure fixed costs don't swallow your early margins.
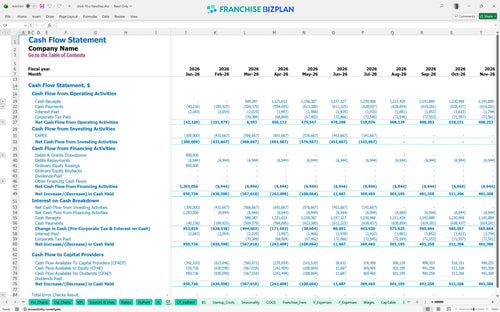
Your lowest cash point occurs in May 2026, with a projected deficit of $597k during the initial ramp-up and construction tail. You need to ensure you have enough working capital to bridge the gap between paying your Hospitality Squad and collecting high-volume daily receipts. The franchise cash flow statement shows that once you clear this hurdle, the business generates significant liquidity. Managing the timing of your $220k signage and exterior spend is key to protecting your bank balance.
Using this modeling operational expenses for QSR franchise units tool, you can see how a 10% drop in drive-thru traffic delays your break-even by months. The high scenario assumes your catering program hits $2.8M by year five, which significantly boosts your year-1 margin and overall valuation. Because royalties are a percentage of sales, your fixed costs stay relatively stable, making volume the most important variable in the entire model. Small wins in productivity can lead to massive swings in take-home pay.
Finance: update unit break-even and payback model by Friday
This franchise financial model template is built in Excel to give you total control over your numbers. You can swap out the pre-filled drive-thru or catering assumptions to match your specific territory or local demand. It uses editable formulas so you can tweak everything from hourly wages to food costs without breaking the logic. This is the most flexible way to build a restaurant business plan Excel that actually reflects your local market reality.

Success in high-volume QSR requires looking past the grand opening to long-term sustainability. This franchise profitability model provides a full 5-year outlook, showing revenue growing from $11.9M to over $19.5M by year five. You get a clear view of your franchise cash flow statement and balance sheet to track how equity builds over time. Long-term planning helps you spot when to reinvest in equipment or when to consider opening a second location.

Operating a top-tier brand means managing significant top-line deductions that impact your unit level economics. This model tracks the 15% royalty fee and 3.25% marketing fund contribution, which total over $2.1M in year one alone. By automating these calculations, you can see exactly how much cash stays in the business after the franchisor takes their cut. Understanding these fixed percentages is vital for maintaining your store-level margin as sales scale.

Launching a high-capacity unit requires a massive upfront commitment, and this tool helps you map every dollar. We include fast food franchise startup costs like the $1.2M leasehold improvement and $850k drive-thru construction. You will learn how to calculate startup costs for a fast food franchise while identifying the exact sales volume needed to cover your $25,000 monthly rent. Knowing your floor helps you manage risk during the critical first few months of operation.

We have integrated real-world data to help you with analyzing labor and inventory costs for franchise units. The model includes benchmarks for a 40-person team and food costs that start at 10.5% and scale down as you gain efficiency. These numbers let you compare your projected performance against industry leaders to see if your labor spend is too high. It is a reality check that ensures your business plan is grounded in operational facts, not just optimism.


Simply purchase and download the financial model template, then access it instantly using Microsoft Excel or Google Sheets. No installation or technical expertise required-just open and start working.

Enter your business-specific numbers, including revenue projections, costs, and investment details. The pre-built formulas will automatically calculate financial insights, saving you time and effort.

Leverage the investor-ready format to confidently showcase your financial projections to banks, franchise representatives, or investors. Impress stakeholders with clear, data-driven insights and professional reports.

Leverage the investor-ready format to confidently present your projections to banks, franchise representatives, or investors.