
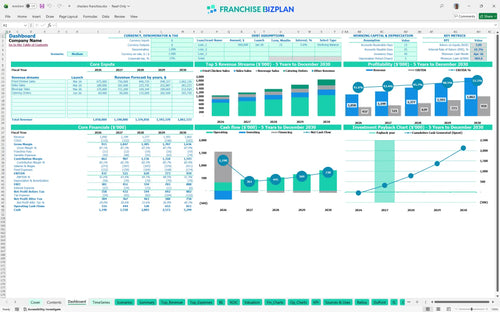
All-in-one Dashboard
Core inputs and core outputs


This franchise unit financial model template provides a complete Excel-based toolkit for forecasting revenue, managing expenses, and calculating investment returns for a new location.
Core inputs and core outputs
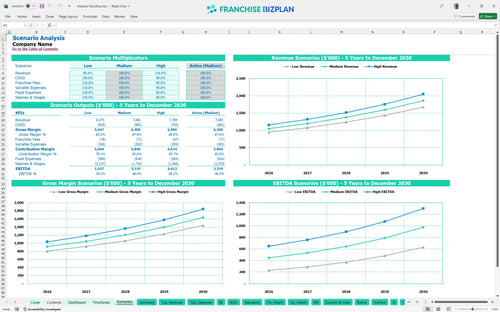
Three scenario analysis
Presentation ready
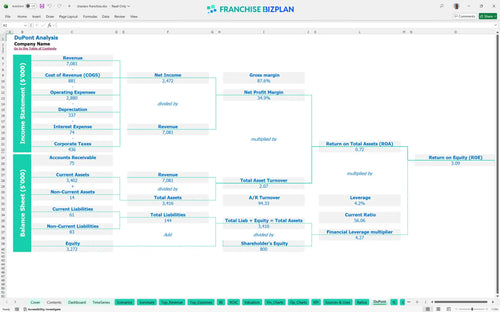
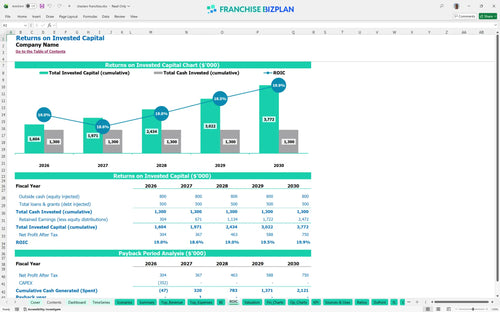
DuPont analysis
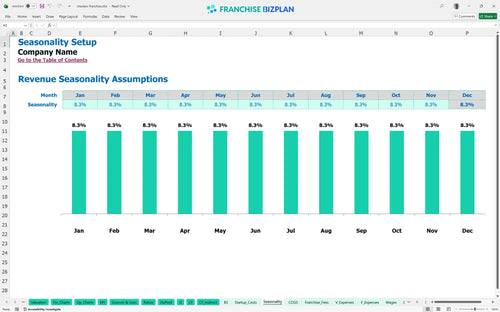
Researched revenue assumptions
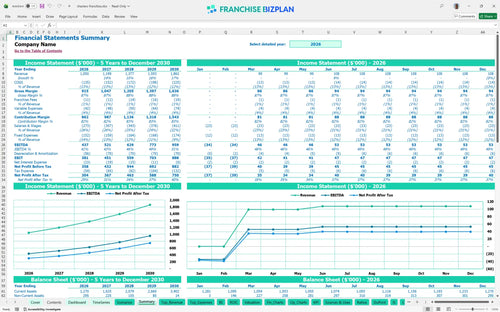
Lender-friendly financial outputs
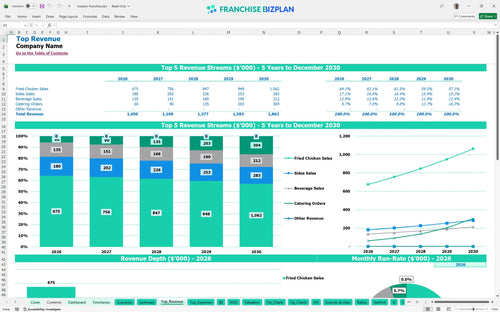
Revenue stream detailed view
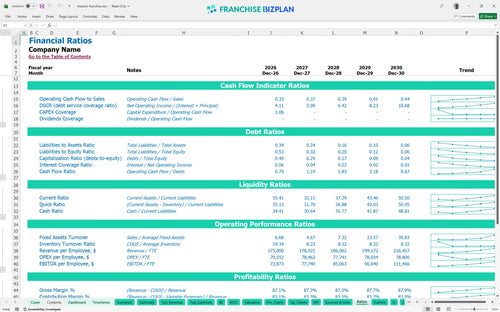
Performance metrics benchmark
We built this franchise unit business plan to show you how to create a financial model for a fast food franchise using our own research into high-volume travel plaza food units. Key assumptions like the $450,000 year-one chicken sales and $8,500 monthly rent are pre-populated and fully editable. Honestly, seeing a $437,000 year-one EBITDA helps you realize the potential of this fried chicken franchise unit.
This unit hits the black faster than most, reaching profitability by April 2026 according to our Excel template for restaurant franchise profitability. After accounting for food costs, the 1% marketing fee, and $1,600 in monthly utilities, the model shows a clear path to a $959,000 EBITDA by year five. Profitability isn't just about sales; it's about controlling the middle of the P&L.
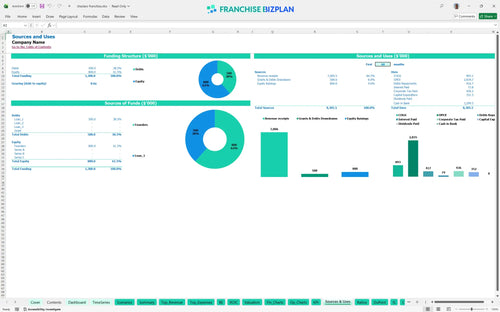
Launching this unit requires a detailed capital expenditure budget to cover the $145,000 in leasehold improvements and $85,000 for equipment. Estimating startup costs for a travel plaza food unit is simplified here, showing you exactly how much cash is needed before the first customer walks in. Knowing where every dollar goes before you break ground is non-negotiable.
The ROI calculation for franchises and our franchise investment calculator show an IRR of 10.27% and a payback period of just 2 years. This franchise investment feasibility study template confirms that with a Return on Equity of 3.09, the model supports a strong case for expansion. A 2-year payback is an aggressive target that requires disciplined execution.
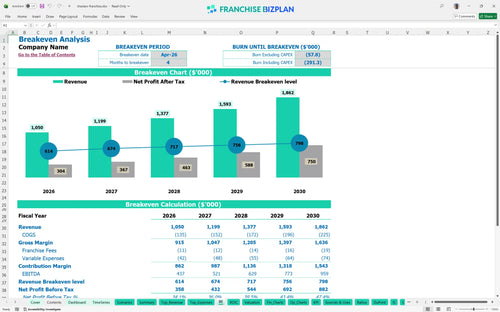
Calculating break-even point for a new franchise location shows you reach the mark by April 2026, just 4 months after opening. This financial planning guide for quick-service restaurant owners highlights that volume is your biggest lever to cover the $8,500 monthly rent. Speed to break-even is the most critical metric for a new operator.
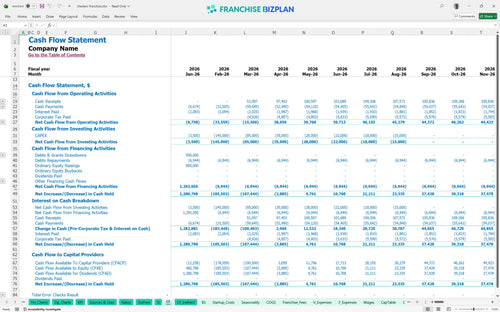
The franchise unit cash flow projection spreadsheet indicates your lowest cash point hits in April 2026 at $984,000. While the runway looks solid, you defintely want to keep a close eye on inventory during the first 90 days to avoid a squeeze. Cash is oxygen, and your ramp-up period is where most units struggle to breathe.
Comparing scenarios shows how a 10% drop in sales can delay your payback period, while analyzing revenue streams for a catering-focused franchise can accelerate it. The high case, driven by kiosk upselling and catering, pushes your year-1 margin significantly higher. Scenario planning turns a static guess into a dynamic strategy.
Finance: update unit break-even and payback model by Friday.
This franchise financial model template is fully customizable in Excel, allowing you to adjust pre-filled formulas and editable assumptions to match your specific market conditions. Whether you are opening in a travel plaza or a standalone site, you can easily tweak the inputs for precise retail food franchise financial projections. Every 1-point margin leak matters fast in a single-unit model.

Planning for long-term success requires more than just a gut feeling; you need a franchise unit cash flow projection spreadsheet that looks ahead. This model provides 5-year projections for revenue, costs, and cash flow, scaling from $1,050,000 in year one to $1,862,000 by year five. Timing gaps between opening costs and mature performance can sink a project.

Understanding your franchise royalty fee structure is vital for maintaining store-level margins over the long haul. This tool captures your $3,500 initial fee and the 1% marketing fund contribution, helping you evaluate how these obligations impact your bottom line. Brand support is great, but you need to know exactly what it costs you monthly.

Calculating the restaurant franchise startup costs is the first step toward a successful launch, from leasehold improvements to initial inventory. This model helps you determine the sales level required to cover your $8,500 monthly rent and other fixed costs. Break-even depends less on headline sales and more on local density.

This model incorporates built-in benchmarks for unit economics analysis, helping you compare your expected performance against industry standards. With food ingredients starting at 11% and packaging at 1.9%, you can quickly identify if your operating expense forecasting is realistic. Sanity-checking your labor spend prevents mid-year cash crunches.


Simply purchase and download the financial model template, then access it instantly using Microsoft Excel or Google Sheets. No installation or technical expertise required-just open and start working.

Enter your business-specific numbers, including revenue projections, costs, and investment details. The pre-built formulas will automatically calculate financial insights, saving you time and effort.

Leverage the investor-ready format to confidently showcase your financial projections to banks, franchise representatives, or investors. Impress stakeholders with clear, data-driven insights and professional reports.

Leverage the investor-ready format to confidently present your projections to banks, franchise representatives, or investors.