
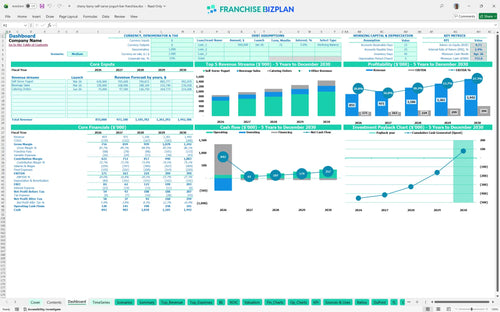
All-in-one Dashboard
Core inputs and core outputs


This financial model template for self-serve yogurt shop includes a complete Excel template for retail franchise financial planning with automated dashboards and detailed monthly schedules.
Core inputs and core outputs
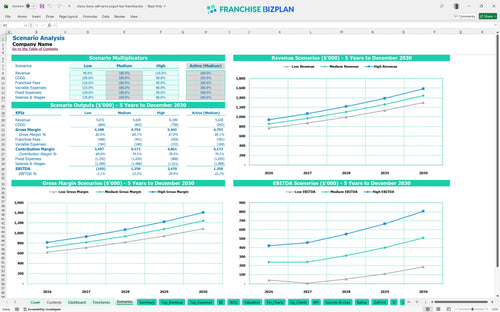
Three scenario analysis
Presentation ready
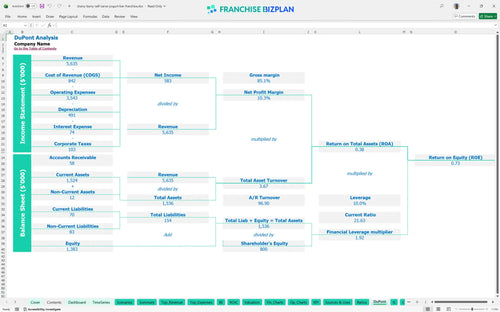
DuPont analysis
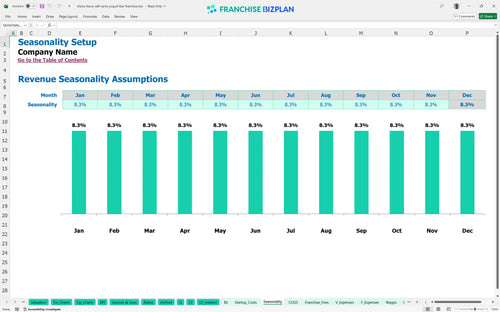
Researched revenue assumptions
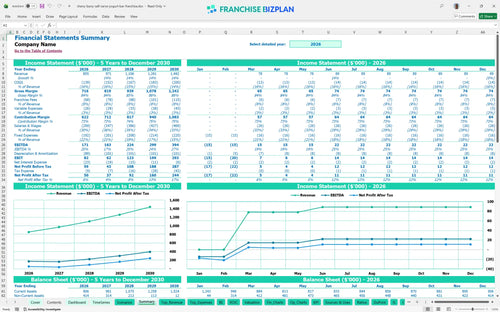
Lender-friendly financial outputs
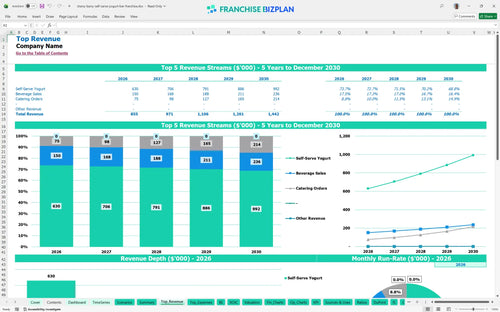
Revenue stream detailed view
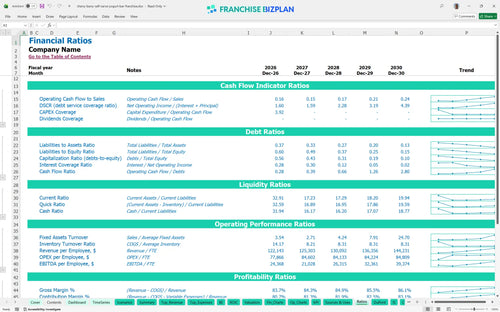
Performance metrics benchmark
We built this franchise unit financial model using our own research to ensure the assumptions reflect the actual costs of a high-traffic yogurt destination. Key metrics like the $855,000 year-one revenue and the 20% EBITDA margin are pre-populated but fully editable to fit your specific mall or street-front location. This data-driven approach helps you move past the sales pitch to the real numbers.
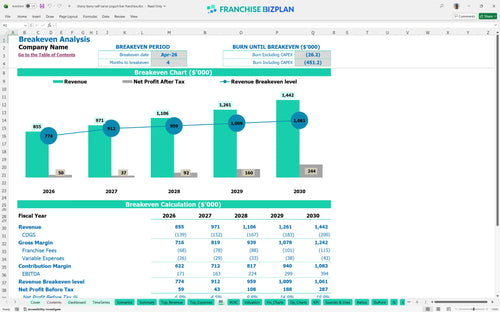
This franchise unit hits frozen yogurt franchise profitability remarkably fast, reaching its break-even point by April 2026, just two months after the March launch. With year-one EBITDA projected at $171,000, the model shows a clear path to scaling earnings as catering and beverage sales ramp up. Profitability is a marathon, but this model starts with a sprint.
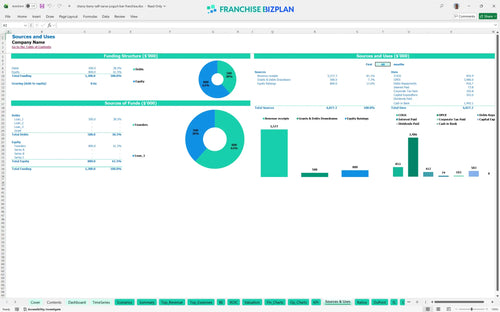
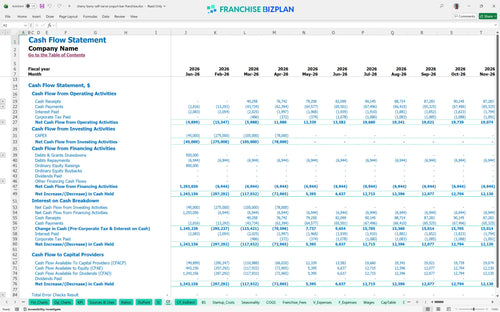
To get the doors open, you need a capital expenditure budget of approximately $503,000, covering everything from the $45,000 franchise fee to $220,000 in leasehold improvements. The model also accounts for $120,000 in specialized yogurt dispensing machines and a $30,000 initial inventory setup to ensure you are ready for day one. Cash is the fuel that keeps the machines turning.
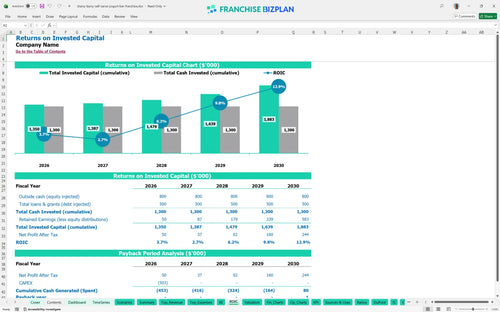
The franchise ROI analysis reveals an Internal Rate of Return (IRR) of 2.41% and a Return on Equity (ROE) of 0.73, with a total payback period of 5 years. While the initial returns are modest, the steady growth in annual revenue from $855,000 to over $1.4 million by year five builds significant long-term equity. A 2.41% IRR means you are playing a very tight game.
The break-even analysis tool indicates the unit must cover $11,000 in monthly mall rent plus significant labor costs for a manager and crew. Because yogurt ingredients are only 13.5% of sales, your break-even is most sensitive to fixed occupancy costs and the $68,000 manager salary. Rent is your biggest fixed hurdle every single month.
The franchise investment analysis spreadsheet identifies April 2026 as the lowest cash point, with a minimum cash balance of $755,000. This suggests you need a substantial liquidity buffer to handle the $503,000 in pre-opening costs and the initial ramp-up phase. You defintely want to keep a close eye on that April floor. Liquidity is your only defense against a slow month.
Forecasting revenue for small franchise units involves testing a 'High' case where revenue hits $1.4M early and a 'Low' case where EBITDA struggles to cover the $11,000 rent. Best financial projection tools for new franchisees show that even a 10% dip in traffic can delay payback by 18 months, making local marketing execution critical. The high case is a goal, but the low case is the reality you must survive.
This franchise financial model template is built in Excel with fully editable assumptions, allowing you to tweak every variable from yogurt flavor costs to seasonal traffic shifts. The pre-filled formulas handle the math so you can focus on testing different business scenarios without breaking the spreadsheet. It is a flexible yogurt shop business plan tool designed for real-world operators. Control your numbers or they will control you.

Our retail franchise financial projections cover a full five-year horizon, mapping out the journey from your grand opening to a mature, multi-unit operation. You get a clear view of how an operating expense forecast interacts with growing revenue streams like catering and beverage sales. Five years is a lifetime in retail, so plan for the long haul.

The franchise startup cost calculator handles the heavy lifting for fees, including the 6% royalty and 2% marketing fund contributions that come off the top. Estimating operating costs for a dessert franchise requires precision, especially when these fees can eat into your store-level margin if throughput isn't optimized. Royalties are a top-line tax that never goes away.

Knowing how to calculate startup costs for a yogurt franchise is the first step toward a sustainable business, and this model breaks down everything from leasehold improvements to initial inventory. Use the startup budget template for retail food franchise to identify exactly when your monthly sales will finally cover your fixed rent and labor. Break-even is the first real victory for any new owner.

We use unit economics to sanity-check your frozen yogurt franchise profit margin analysis against industry standards for labor and COGS (Cost of Goods Sold). By comparing your projected 13.5% ingredient cost against typical dessert shop benchmarks, you can identify if your waste or portion control is out of alignment. Benchmarks keep your ego in check and your margins in line.


Simply purchase and download the financial model template, then access it instantly using Microsoft Excel or Google Sheets. No installation or technical expertise required-just open and start working.

Enter your business-specific numbers, including revenue projections, costs, and investment details. The pre-built formulas will automatically calculate financial insights, saving you time and effort.

Leverage the investor-ready format to confidently showcase your financial projections to banks, franchise representatives, or investors. Impress stakeholders with clear, data-driven insights and professional reports.

Leverage the investor-ready format to confidently present your projections to banks, franchise representatives, or investors.