
All-in-one Dashboard
Core inputs and core outputs


This Excel template for franchise unit financial planning includes a comprehensive pro forma, automated cash flow tracking, and a detailed payroll calculator tailored for a mobile service model.
Core inputs and core outputs
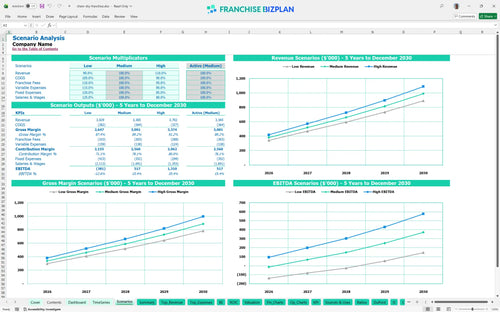
Three scenario analysis
Presentation ready
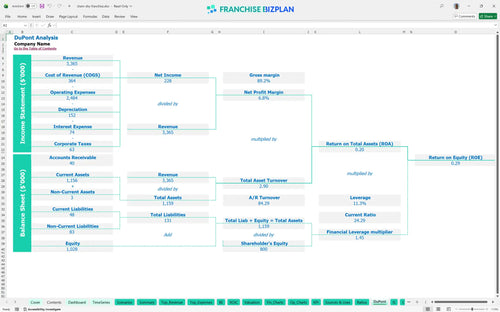
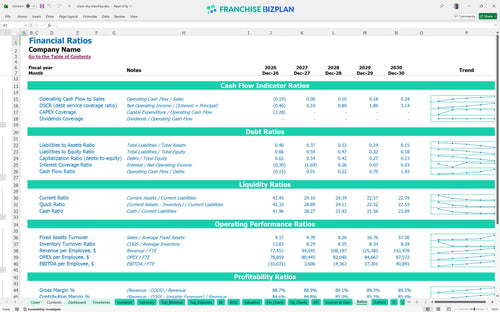
DuPont analysis
Researched revenue assumptions
Lender-friendly financial outputs
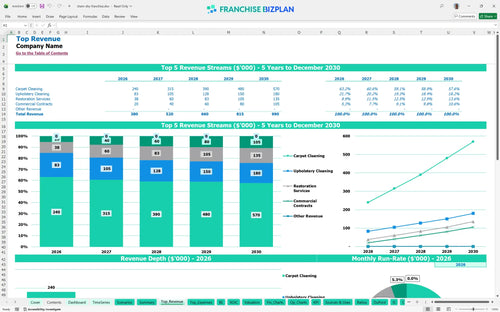
Revenue stream detailed view
Performance metrics benchmark
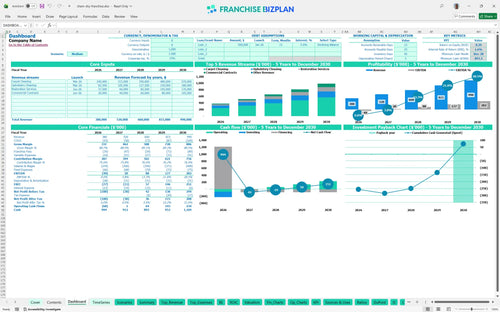
We built this franchise unit financial model using our own research into the mobile cleaning and restoration sector. Key assumptions, including the $380,000 Year 1 revenue target and the $155,000 initial CAPEX, are pre-populated with researched data and are fully editable. This tool helps you visualize the transition from a Year 1 EBITDA loss of $49,000 to a Year 5 profit of $282,000, providing a clear roadmap for your investment.
The unit is projected to reach EBITDA profitability in Year 2, generating approximately $20,000 in earnings after all operating expenses. By Year 5, net profit scales significantly to $282,000 as you optimize your technician headcount and expand into higher-margin restoration services and commercial contracts.
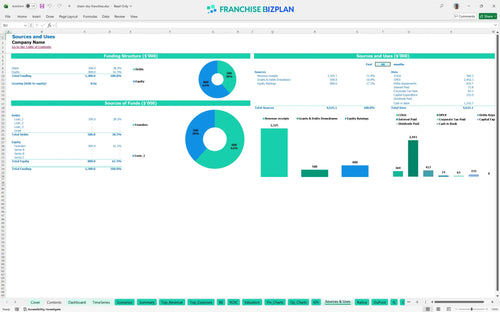
You will need approximately $155,000 to launch this franchise unit in the US, covering the $36,000 franchise fee and $89,000 in equipment and vehicles. This total initial investment also accounts for office setup, training, and an initial supplies inventory of $9,000 to ensure you are ready for day-one operations.
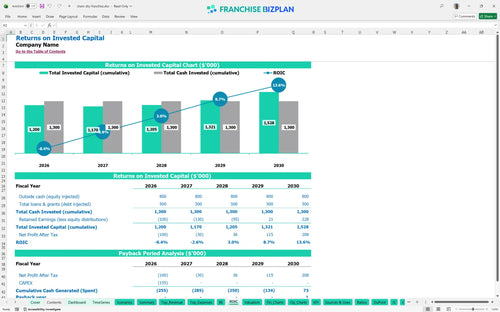
Investors can expect an Internal Rate of Return (IRR) of 1.57% and a Return on Equity (ROE) of 0.29 based on the 5-year outlook. The payback period is estimated at 5 years, as the business requires time to ramp up revenue from $380,000 to nearly $1 million while absorbing initial equipment costs.
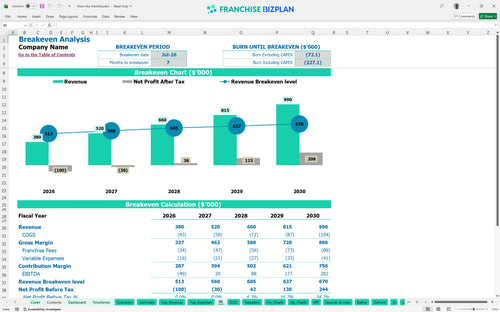
The monthly break-even point is reached in July 2026, roughly 7 months after the initial launch. The primary driver for break-even is job volume; you must generate enough daily traffic to cover $5,530 in monthly fixed costs, including your $1,800 vehicle lease and $1,200 office storage rent.
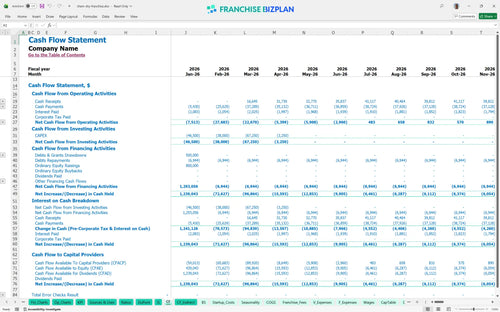
Your lowest cash point occurs in December 2028, meaning you need to maintain a disciplined approach to spending during the first three years. You should defintely monitor your payroll closely, as the crew technician FTE (full-time equivalent) grows from 1.8 to 3.4 over the five-year period to support rising demand.
In a High scenario, aggressive local marketing and high retention could push Year 1 revenue above the $380,000 baseline, accelerating your payback. A Low scenario, perhaps due to slow commercial adoption, would increase your peak cash need and delay the point where you can comfortably draw a significant owner dividend.
Finance: update unit break-even and payback model by Friday.
This franchise unit financial model is fully customizable in Excel, allowing you to adjust everything from the $36,000 initial fee to specific local labor rates. The pre-filled formulas and editable assumptions make it easy to adapt the template to your specific territory, whether you are looking at a single van or a multi-unit territory expansion. You can quickly run 'what-if' scenarios to see how a change in average ticket price affects your bottom line.

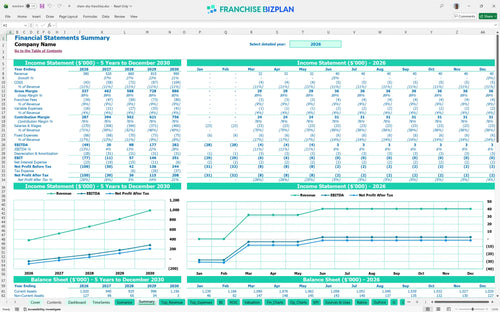
Success in this industry requires looking beyond the first few months to understand long-term cleaning service franchise profitability. This model provides detailed 5-year revenue forecasts, showing a trajectory from $380,000 in Year 1 to $990,000 by Year 5. It includes a full balance sheet and cash flow view to help you manage the timing gaps between equipment payments and incoming receivables from commercial contracts.

The model is built to capture the specific financial obligations of a franchise, including the 6% royalty and 3% marketing fund contributions. By automating these calculations, you can see the real economics of the unit after the franchisor takes their cut. Estimating ongoing royalty and marketing fees for franchises is essential to ensure your store-level margin remains healthy enough to cover your $1,200 monthly rent and $1,800 vehicle leases.

How to calculate startup costs for a carpet cleaning franchise becomes simple with our integrated startup budget template for local service businesses. The model aggregates your $155,000 initial investment, including $34,000 in primary and secondary equipment and $55,000 for a service van. Analyzing break-even point for home service franchises shows you exactly when your monthly revenue will cover your fixed and variable costs, which is projected for July 2026.

We have incorporated built-in industry benchmarks to help you sanity-check your carpet cleaning business plan against real-world data. For instance, proprietary cleaning solutions are modeled at approximately 9% of sales, while fuel and vehicle maintenance are set at 2.8%. These financial metrics to evaluate a cleaning service franchise allow you to compare your expected performance against typical ranges for mobile service brands, ensuring your pro forma is grounded in reality.


Simply purchase and download the financial model template, then access it instantly using Microsoft Excel or Google Sheets. No installation or technical expertise required-just open and start working.

Enter your business-specific numbers, including revenue projections, costs, and investment details. The pre-built formulas will automatically calculate financial insights, saving you time and effort.

Leverage the investor-ready format to confidently showcase your financial projections to banks, franchise representatives, or investors. Impress stakeholders with clear, data-driven insights and professional reports.

Leverage the investor-ready format to confidently present your projections to banks, franchise representatives, or investors.