
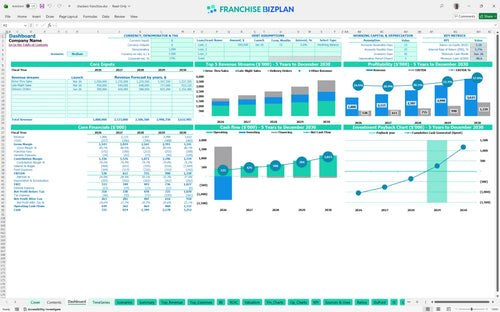
All-in-one Dashboard
Core inputs and core outputs


This comprehensive financial tool includes everything from startup cost breakdowns to five-year cash flow forecasts for a high-volume double drive-thru unit.
Core inputs and core outputs
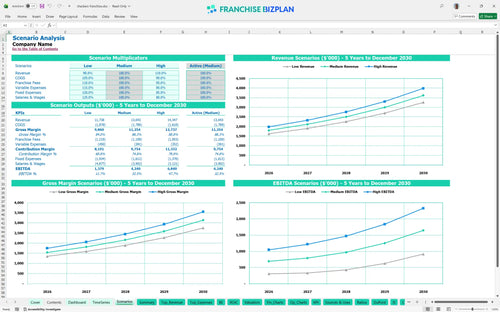
Three scenario analysis
Presentation ready
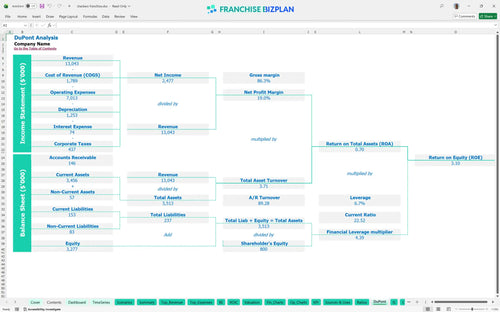
DuPont analysis
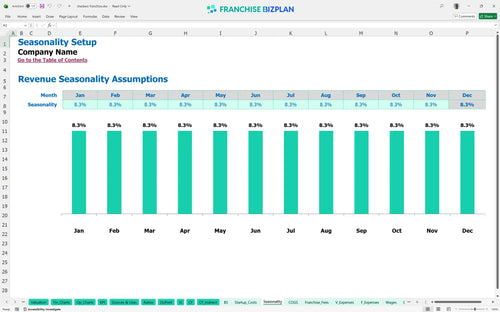
Researched revenue assumptions
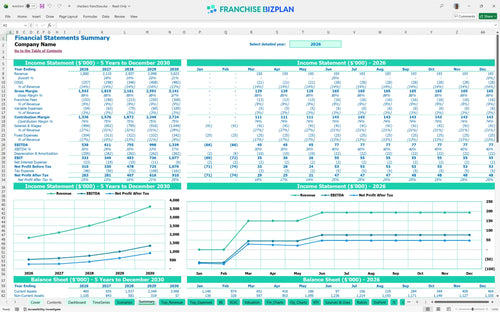
Lender-friendly financial outputs
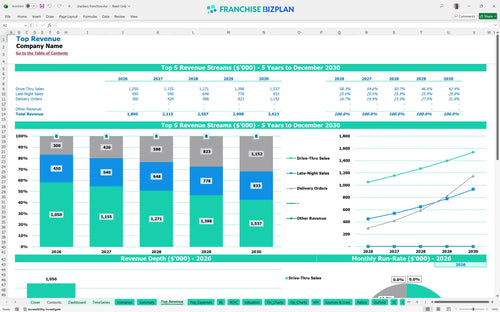
Revenue stream detailed view
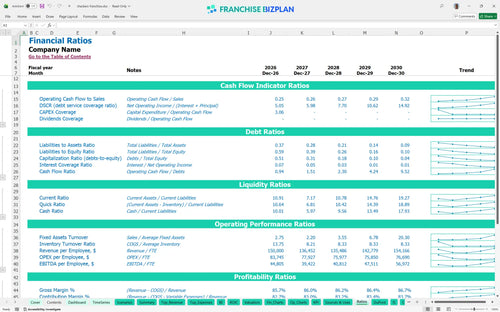
Performance metrics benchmark
We built this franchise unit financial model using deep research into the double drive-thru sector to ensure every assumption is grounded in reality. The model comes pre-populated with data like the $1.3M total CAPEX and 4.5% marketing fees, showing a clear path to $538,000 in year-one EBITDA while remaining fully editable for your specific territory.
This Excel template for franchise unit financial forecasting shows the unit becoming profitable in April 2026, just four months after opening. By year five, net profit scales significantly as revenue hits $3.6M and food costs drop to 11.5% through better waste management. Profitability is a marathon, not a sprint, but this unit starts fast.
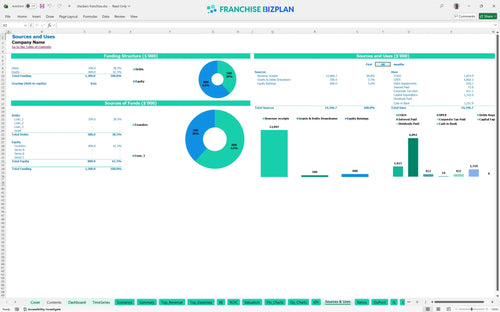
To understand how to calculate startup costs for a fast food franchise, you must account for the $1.31M total investment, which includes a $30,000 fee and $650,000 in leasehold improvements. This startup cost breakdown for quick service restaurants also factors in $220,000 for kitchen equipment and $25,000 for initial inventory. Build-out is your biggest hurdle, so track every dollar.
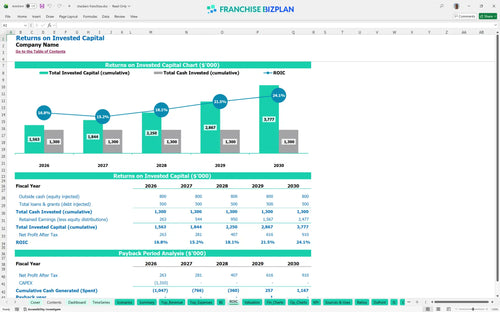
Investors can expect a 4-year payback period and an internal rate of return of 3.71% based on this franchise ROI calculator. The franchise investment feasibility study template indicates a return on equity of 3.1, with EBITDA growing from $538k to $1.33M over the first five years of operation. Mature EBITDA shows the long-term strength of the model.
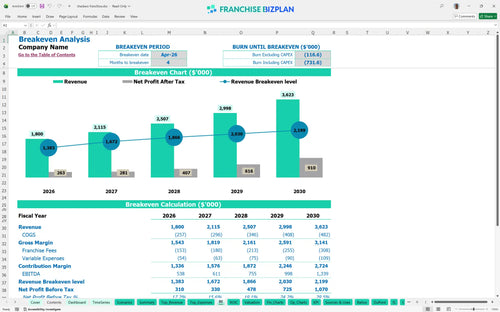
The double drive-thru restaurant business model template identifies a 4-month window to reach break-even, primarily driven by the high $18,000 monthly rent and 8.5% total franchise fees. High traffic volume is the defintely the key lever here, as fixed costs remain steady regardless of whether you serve 100 or 500 cars. High traffic is the only way to outrun high rent.
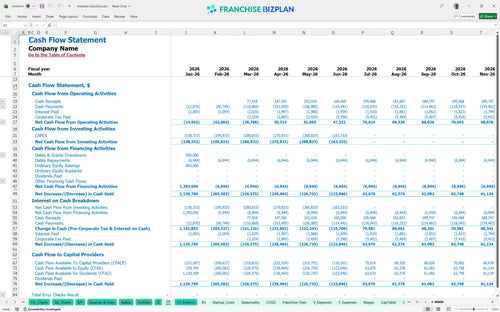
When estimating operating expenses for a QSR franchise, the model highlights a cash floor of -$41,000 in June 2026, requiring a small additional buffer. You will need roughly six months of runway to navigate the gap between the $650,000 build-out payments and the ramp-up of delivery revenue. Timing your CAPEX is the key to surviving the ramp-up.
Learning how to build a financial model for a food franchise allows you to see that a high-growth scenario boosts year-5 EBITDA to $1.33M. Conversely, a low-growth case where delivery orders lag could delay your 4-year payback and strain your ability to cover the $72,000 manager salary. The high-case scenario is won through delivery and waste control.
This franchise financial model template is fully customizable in Excel, allowing you to adjust every driver from drive-thru traffic to late-night delivery splits. It features pre-filled formulas and editable assumptions so you can stress-test how a shift in labor costs or food prices impacts your bottom line in real-time. It's built for the person who needs to know if a site actually pencils out.

Long-term planning requires more than just a gut feeling, so this tool provides detailed franchise unit financial projections over a 60-month period. You can track your path from $1.8M in initial annual sales to a mature $3.6M volume, ensuring your cash flow and profit targets remain realistic as you scale operations. Long-term planning is the difference between an owner and an operator.

Managing a brand means accounting for fixed costs like the 4% royalty and 4.5% marketing fund contributions that come off the top. This model simplifies operating expense forecasting by automating these calculations, so you always know exactly how much is heading to the franchisor before you cover your local overhead. EBITDA is always accurate when fees are automated.

Using this restaurant franchise startup costs excel, you can map out the $1.3M initial investment and identify the exact sales volume needed to cover your $18,000 monthly rent. The break-even analysis template helps you visualize the intersection of fixed costs and variable margins to ensure your site selection supports your debt service. Know exactly when the bleeding stops and the profit starts.

This QSR franchise profitability analysis worksheet includes built-in industry benchmarks to help you verify if your 12.5% food cost or 16-person crew size is in line with top performers. It's a reality check for your pro forma, ensuring your assumptions about throughput and ticket size aren't just wishful thinking but grounded in sector standards. Don't guess; verify your performance against the pros.


Simply purchase and download the financial model template, then access it instantly using Microsoft Excel or Google Sheets. No installation or technical expertise required-just open and start working.

Enter your business-specific numbers, including revenue projections, costs, and investment details. The pre-built formulas will automatically calculate financial insights, saving you time and effort.

Leverage the investor-ready format to confidently showcase your financial projections to banks, franchise representatives, or investors. Impress stakeholders with clear, data-driven insights and professional reports.

Leverage the investor-ready format to confidently present your projections to banks, franchise representatives, or investors.