
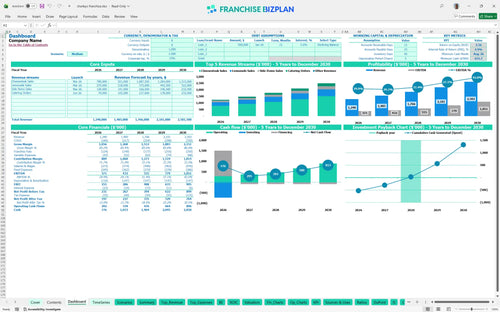
All-in-one Dashboard
Core inputs and core outputs


This tool provides a complete set of financial statements and operational calculators designed specifically for a fast-casual unit operator.
Core inputs and core outputs
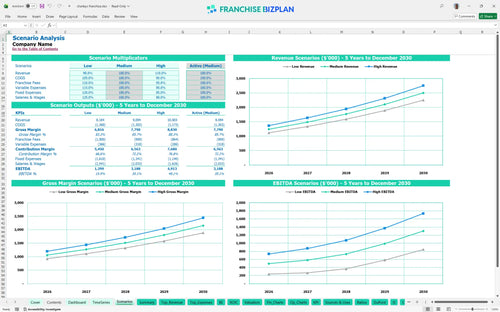
Three scenario analysis
Presentation ready
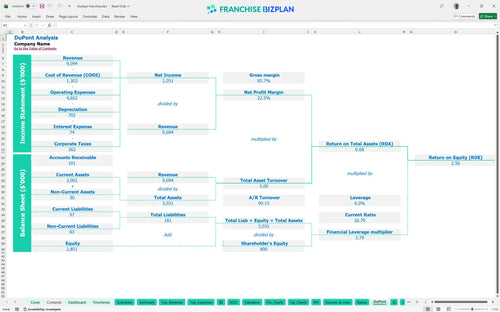
DuPont analysis
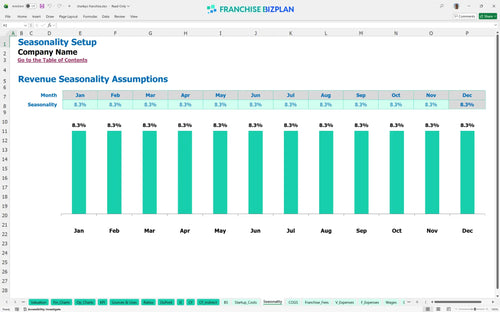
Researched revenue assumptions
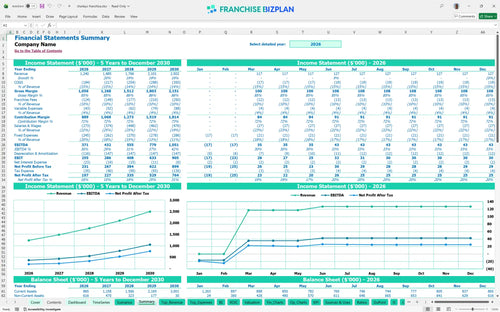
Lender-friendly financial outputs
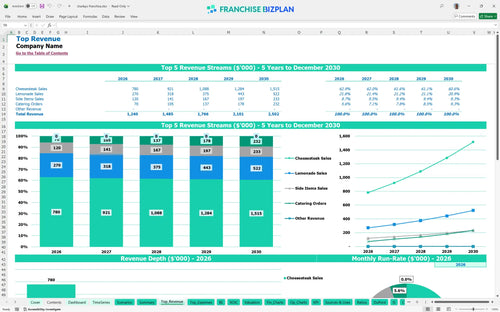
Revenue stream detailed view
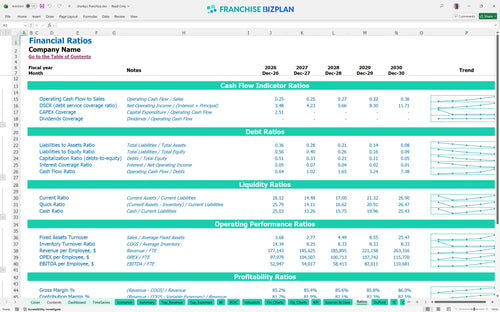
Performance metrics benchmark
We built this model using detailed research into the fast-casual sector to ensure your planning is grounded in reality. Key drivers like the 6% royalty fee and 4% marketing contribution are pre-populated but fully editable, so you can use this as a precise franchise investment calculator. With a year-one revenue target of $1,240,000, this tool helps you map out the path to a $371,000 EBITDA.
Based on the $1,240,000 year-one revenue and $371,000 EBITDA, the unit is defintely on track for early profitability. You can use this profitability analysis for fast casual restaurant units to see how the bottom line grows to $1,051,000 by year five as you scale and learn how to forecast catering revenue for a restaurant.
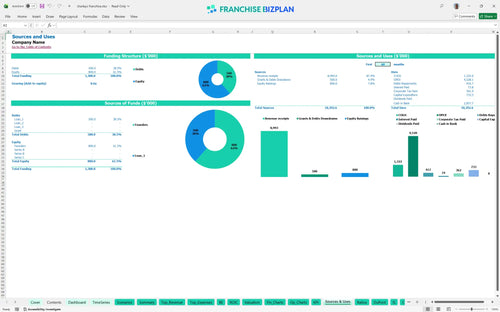
You need to plan for a significant upfront investment, primarily driven by $320,000 in leasehold improvements and $165,000 for kitchen equipment. This capital expenditure forecasting helps you track every dollar from the initial $24,500 franchise fee to the final signage costs, ensuring you know how to calculate startup costs for a food franchise.
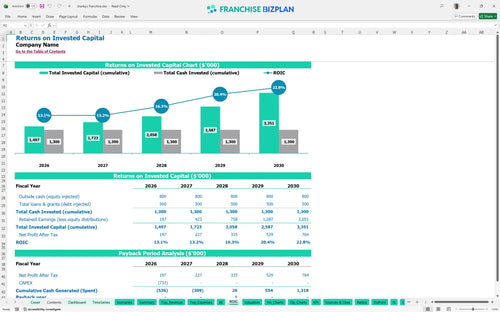
Investors can expect an IRR of 4.87% and a 3-year payback period based on the current projections. Evaluating franchise investment opportunities financial model requires looking at the 2.56 ROE to ensure the risk matches the reward for this specific fast-casual location.
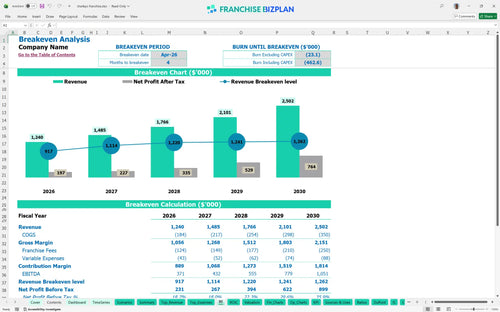
The unit hits the break-even point in April 2026, just 4 months after launch. Using this best excel template for franchise unit business planning, you can see that estimating franchise operating costs for investors is critical, as managing the $14,500 monthly rent is the biggest hurdle to clearing fixed costs.
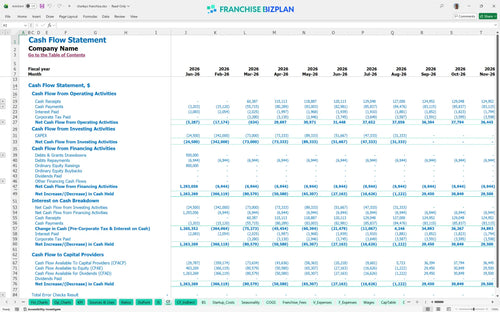
The lowest cash point occurs in August 2026 at $656,000, so you need to maintain a solid buffer during the ramp-up. This franchise unit cash flow statement example shows that while revenue grows, timing gaps in payables can squeeze liquidity for a financial model for new restaurant franchise location.
By toggling between Low, Medium, and High cases, you can see how a 10% swing in labor costs affects your year-one margin. This restaurant franchise labor cost forecasting tool helps you prepare for the $1,051,000 high-case EBITDA or a slower climb if local demand fluctuates.
This franchise financial model template is built in Excel with a logic that is easy to follow. You can adjust every assumption, from the $520,000 year-one core product sales to specific local labor rates, using this restaurant franchise financial projection template excel to see how changes hit your bottom line.

Planning for the long term is essential when developing a fast casual restaurant business plan. This model maps out five years of growth, showing how annual revenue can climb from $1,240,000 in year one to $2,502,000 by year five, providing a clear view of your unit's scaling potential and cash flow needs.

Operating a branded unit means managing specific overhead like the 6% royalty fee and 4% marketing fund contribution. This franchise unit profit and loss template bakes these costs directly into your monthly cash flow, so you always know exactly how much is left for the bottom line after meeting your brand obligations.

Understanding your restaurant franchise startup costs is the first step to a successful launch. This model includes a detailed break-even point calculation, helping you identify the exact sales volume needed to cover your $14,500 monthly rent and other fixed expenses while tracking your initial $732,500 capital outlay.

This model uses built-in benchmarks for operating expenses for restaurants to help you sanity-check your numbers. By comparing your projected ROI analysis against industry standards, you can ensure your labor costs and food margins remain competitive within the fast-casual landscape.


Simply purchase and download the financial model template, then access it instantly using Microsoft Excel or Google Sheets. No installation or technical expertise required-just open and start working.

Enter your business-specific numbers, including revenue projections, costs, and investment details. The pre-built formulas will automatically calculate financial insights, saving you time and effort.

Leverage the investor-ready format to confidently showcase your financial projections to banks, franchise representatives, or investors. Impress stakeholders with clear, data-driven insights and professional reports.

Leverage the investor-ready format to confidently present your projections to banks, franchise representatives, or investors.