


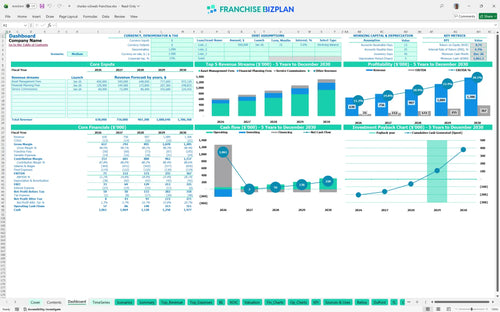
All-in-one Dashboard
Core inputs and core outputs



This tool provides a complete financial roadmap that shows you exactly how to build a financial model for an investment branch from day one through year five.
Core inputs and core outputs
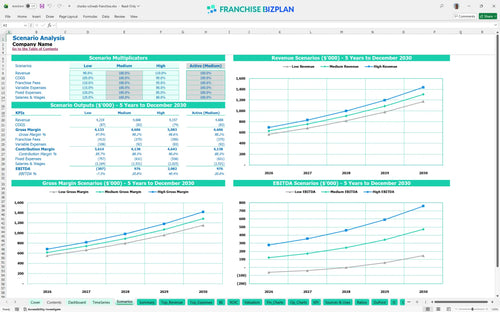
Three scenario analysis
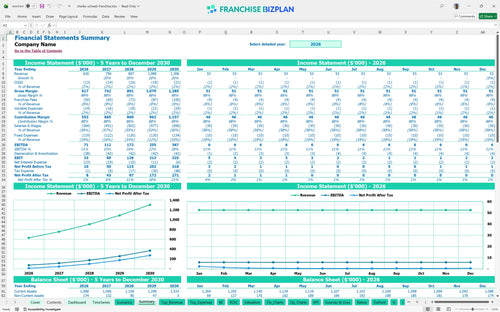
Presentation ready
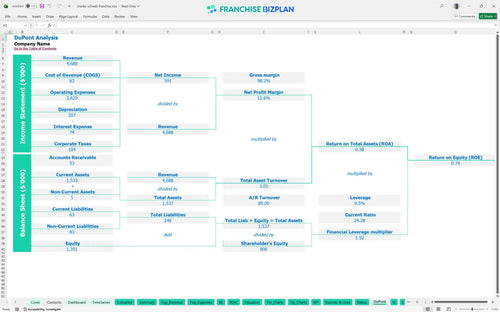
DuPont analysis
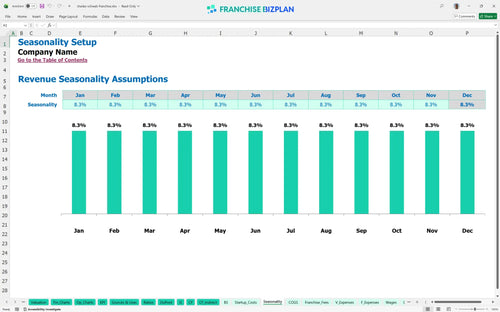
Researched revenue assumptions
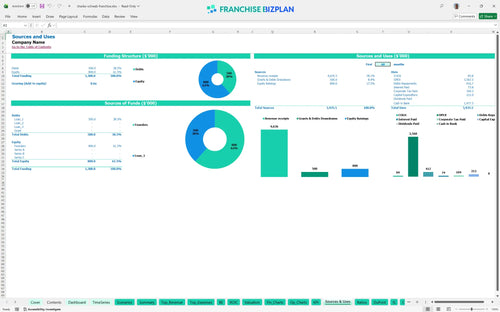
Lender-friendly financial outputs
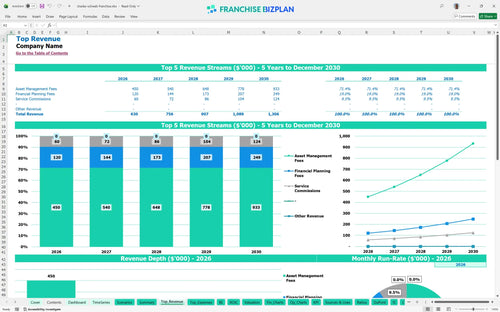
Revenue stream detailed view
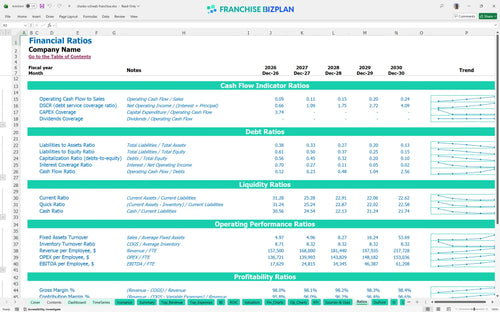
Performance metrics benchmark
We built this franchise unit financial model using our own research to provide a realistic look at this financial advisory franchise opportunity. Key assumptions for this wealth management business model, including $630,000 in Year 1 revenue and $71,000 in EBITDA, are pre-populated and fully editable to fit your specific market. Real-world data keeps your expectations grounded.
This unit reaches profitability in its first year, specifically by January 2026, as Year 1 EBITDA hits $71,000. After accounting for the 8% royalty and $7,500 monthly rent, you are defintely in the black early if you hit your assets under management projections. Profitability is about advisor productivity, not just AUM. This investment management franchise profitability analysis shows a steady climb to $367,000 EBITDA by Year 5.
You need $212,000 in total capital to launch this branch, which is detailed in our financial advisor branch startup costs excel template. This includes the $50,000 franchise fee, $60,000 for office improvements, and $30,000 for IT equipment. Knowing your hard costs upfront prevents mid-build surprises. These startup capital requirements for financial advisory branch units ensure you are properly capitalized for a premium North Scottsdale-style build-out.
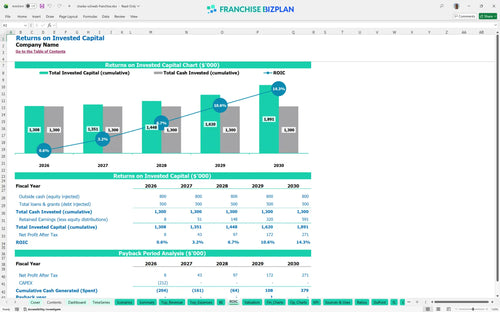
Investors can expect an Internal Rate of Return (IRR) of 4.29% and a payback period of 4 years. While the ROE is 0.74, the wealth management business plan financial spreadsheet shows significant cash flow growth as the branch matures. Calculating AUM growth for new advisory branches is the primary way to drive these long-term returns. Long-term wealth management is a marathon, not a sprint.
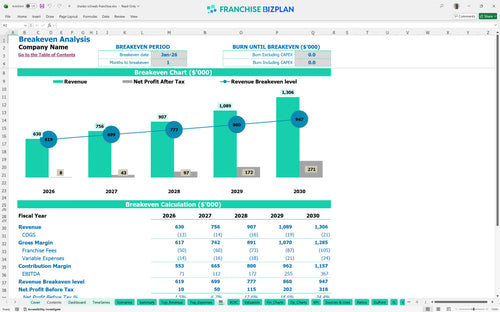
The monthly break-even point is reached in January 2026, the very first month of operation, provided you launch with a base of assets. Using a financial advisor franchise revenue calculator, we see that covering the $9,900 in monthly fixed costs depends heavily on your initial client onboarding speed. Volume is the primary lever for covering your fixed overhead. Still, the low variable costs help you stay above water once the doors open.
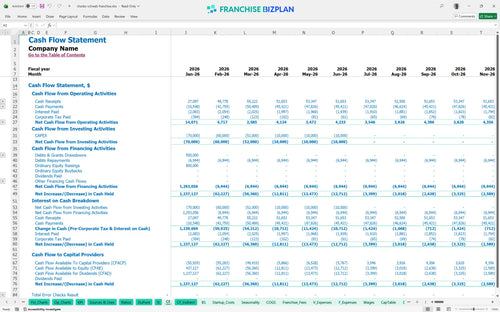
The lowest cash point is $1,061,000 in December 2026, which indicates a very healthy capital buffer throughout the ramp-up phase. You must monitor operating expenses for wealth management franchise locations to ensure your $7,500 rent and advisor salaries don't erode this position. A solid cash floor is your best defense against market swings. Runway is rarely an issue here if your initial funding is secured.
Our financial planning business model template for advisors allows you to compare Low, Medium, and High scenarios to see how Year 5 EBITDA fluctuates from the $367,000 base. These shifts are usually driven by advisor productivity and client retention rates. Stress-testing your assumptions is the only way to plan for the unknown. This is vital for independent advisory firm financial planning in a volatile market.
Finance: update unit break-even and payback model by Friday.
This financial services franchise template is fully customizable in Excel, allowing you to adjust every driver from asset management fees to advisor headcount. You can easily modify pre-filled formulas and editable assumptions to match your specific territory, local rent costs, and expected client acquisition rates. Every 1-point margin leak matters fast in a single-unit model.

Plan for sustainable growth with an independent wealth management franchise financial projection that spans five years. This model provides a detailed financial advisor P&L statement, tracking how your bottom line evolves as your assets under management scale from Year 1 to Year 5. Timing gaps between opening costs and mature performance are the real killers.

Managing your ongoing obligations is simple with dedicated inputs for the 8% royalty fee and initial $50,000 franchise fee. The model tracks these wealth management revenue streams and automatically calculates the impact of brand-specific costs on your store-level margin. Royalties come off the top, so gross margin is your best friend.

Calculate your total investment branch startup costs by mapping out everything from office improvements to IT equipment. This analysis helps you determine the exact revenue level needed to cover your $9,900 in monthly fixed costs and reach your break-even point. Break-even depends more on local density than headline sales.

Use built-in advisory practice profitability metrics to compare your projected performance against industry standards for labor and occupancy. By tracking franchise unit operational expenses like professional liability insurance and premium rent, you can ensure your unit stays within healthy margin ranges. Sanity-checking your labor spend prevents mid-year cash crunches.


Simply purchase and download the financial model template, then access it instantly using Microsoft Excel or Google Sheets. No installation or technical expertise required-just open and start working.

Enter your business-specific numbers, including revenue projections, costs, and investment details. The pre-built formulas will automatically calculate financial insights, saving you time and effort.

Leverage the investor-ready format to confidently showcase your financial projections to banks, franchise representatives, or investors. Impress stakeholders with clear, data-driven insights and professional reports.

Leverage the investor-ready format to confidently present your projections to banks, franchise representatives, or investors.