
All-in-one Dashboard
Core inputs and core outputs


This franchise investment analysis tool includes a complete set of financial statements, automated CAPEX tracking, and detailed payroll calculators for a professional services team.
Core inputs and core outputs
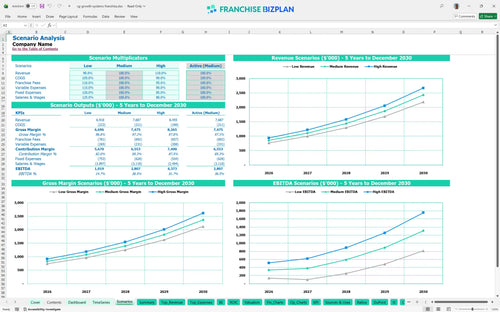
Three scenario analysis
Presentation ready
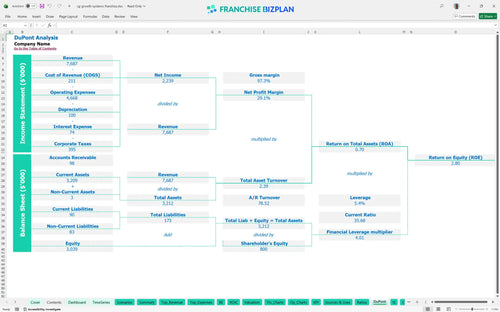
DuPont analysis
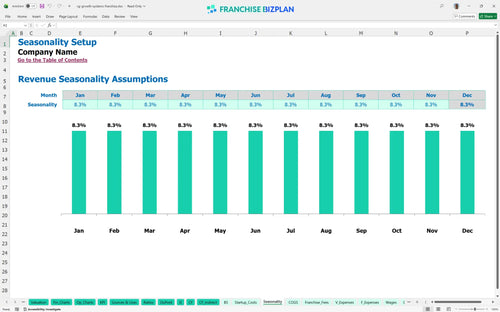
Researched revenue assumptions
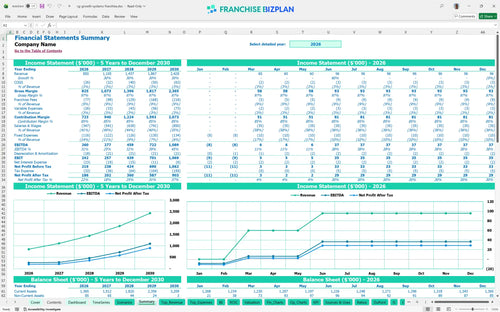
Lender-friendly financial outputs
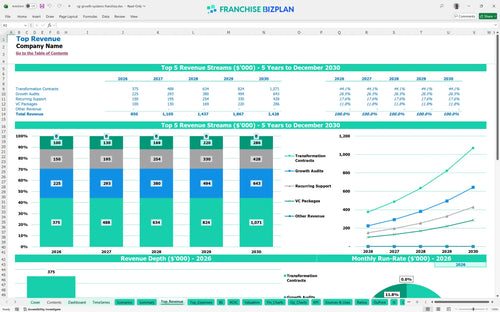
Revenue stream detailed view
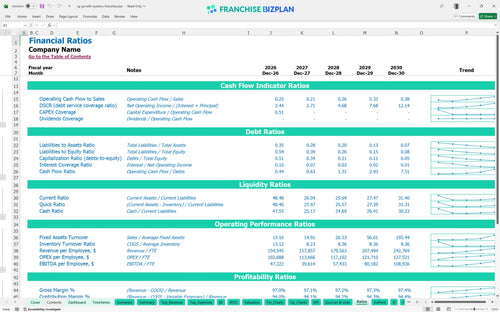
Performance metrics benchmark
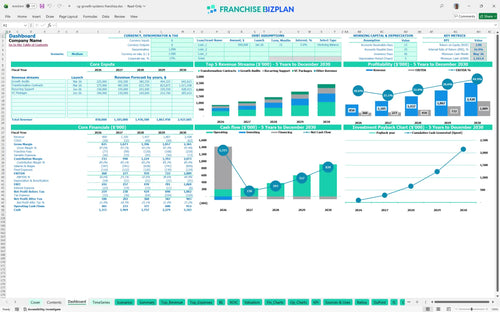
This business consulting franchise opportunity model was developed using detailed research on professional service unit economics. We pre-populated the tool with data showing a year one revenue of $850,000 and an EBITDA of $260,000, but every assumption from the $15,000 franchise fee to the 7% royalty is fully editable to fit your specific plan.
The unit is projected to be profitable in its first year of operation, generating $260,000 in EBITDA. Profitability grows significantly by year five, reaching an estimated $1,089,000 as transformation contracts and recurring support revenue scale up.
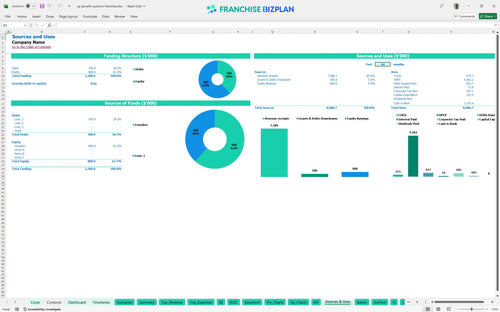
Launching this unit requires a total initial investment of approximately $103,000 in capital expenditures plus working capital. This covers the $15,000 franchise fee, office build-out, and the high-tech digital dashboard implementation needed for client transparency.
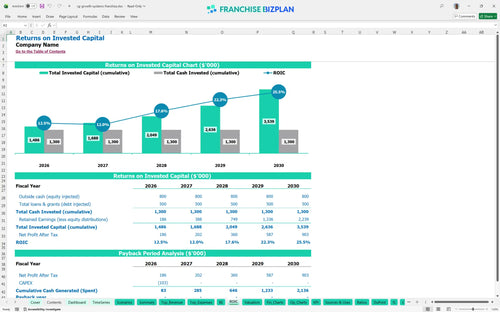
The franchise investment analysis shows an Internal Rate of Return (IRR) of 16.88% and a Return on Equity (ROE) of 2.8. While the model shows strong annual cash flow, the full payback of the initial investment occurs after year five due to the heavy ramp-up in professional staffing.
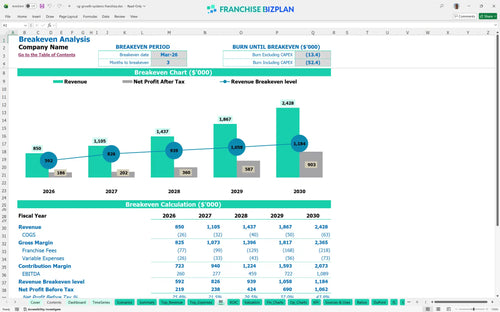
The unit reaches its break-even date in March 2026, just three months after launch. The primary driver for hitting this point is the rapid execution of Growth Audits and Transformation Contracts to cover the $6,500 monthly rent and fixed insurance costs.
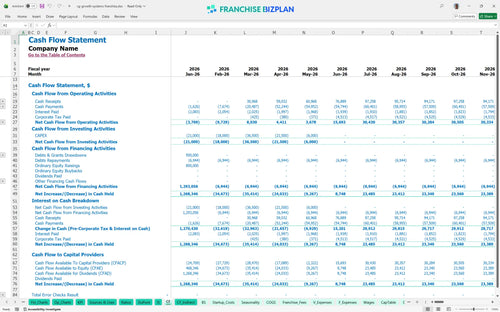
The lowest cash point is projected for May 2026, with a minimum cash balance of $1,165,000. This suggests a significant initial capital buffer is maintained to manage scaling bottlenecks in franchise operations as the consulting team expands from 4.5 to 10 FTEs.
This financial planning guide for franchise owners shows that high-case scenarios significantly pull forward the $1.08M EBITDA target. Conversely, a low-case scenario with slower contract wins would increase the working capital pressure during the year-one ramp-up when payroll is highest.
Finance: update unit break-even and payback model by Friday
This franchise financial model template is built in Excel to give you total control over your numbers. You can adjust pre-filled formulas and editable assumptions for revenue drivers, staffing levels, and local operating costs to match your specific territory and market conditions.

Plan your long-term growth with a business growth franchise model that tracks performance from day one through year five. The tool provides detailed forecasts for revenue, which scales from $850,000 in year one to over $2.4 million by year five, alongside clear cash flow and profit projections.

Managing franchise royalty fees is simple with built-in logic for a 7% royalty and a 2% brand marketing fund contribution. The model accounts for these ongoing obligations and the initial $15,000 franchise fee to ensure you see the true store-level margin after all franchisor payments.

Calculate your franchise unit startup costs with precision, including $30,000 for leasehold improvements and $20,000 for computer equipment. You will defintely need to know the exact sales volume required to cover your $6,500 monthly rent and professional staff payroll before you sign a lease.

Use this model to evaluate profitability metrics for service-based franchises by comparing your projected labor and occupancy costs against industry standards. With a managing director salary set at $110,000 and senior consultants at $85,000, you can see how your overhead impacts the bottom line.


Simply purchase and download the financial model template, then access it instantly using Microsoft Excel or Google Sheets. No installation or technical expertise required-just open and start working.

Enter your business-specific numbers, including revenue projections, costs, and investment details. The pre-built formulas will automatically calculate financial insights, saving you time and effort.

Leverage the investor-ready format to confidently showcase your financial projections to banks, franchise representatives, or investors. Impress stakeholders with clear, data-driven insights and professional reports.

Leverage the investor-ready format to confidently present your projections to banks, franchise representatives, or investors.