
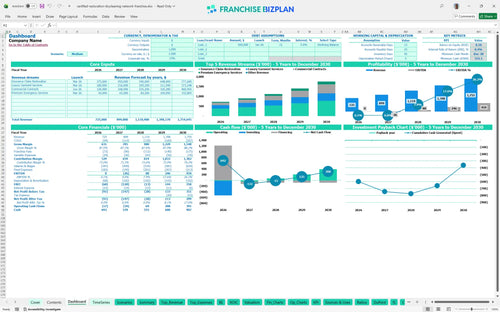
All-in-one Dashboard
Core inputs and core outputs


This financial model template for dry cleaning franchise unit includes integrated income statements, cash flow tracking, and CAPEX schedules for restoration equipment.
Core inputs and core outputs
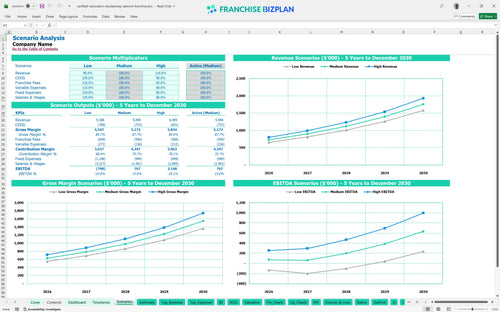
Three scenario analysis
Presentation ready
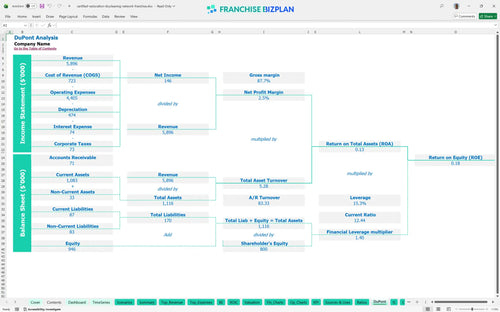
DuPont analysis
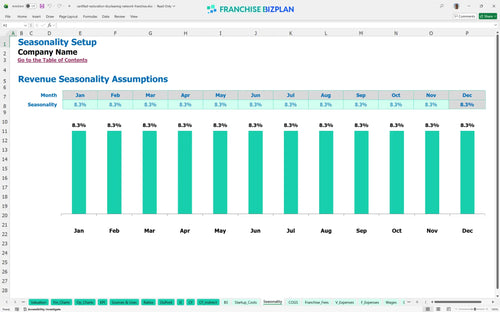
Researched revenue assumptions
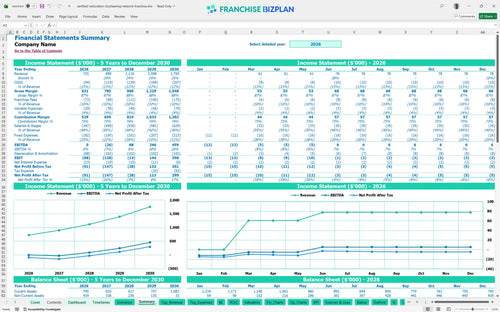
Lender-friendly financial outputs
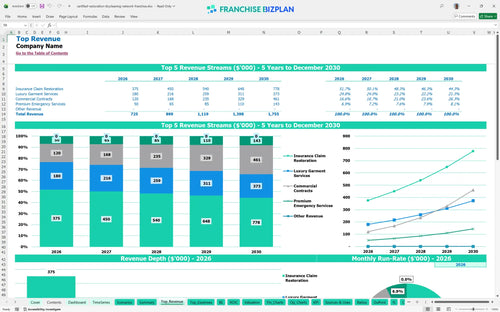
Revenue stream detailed view
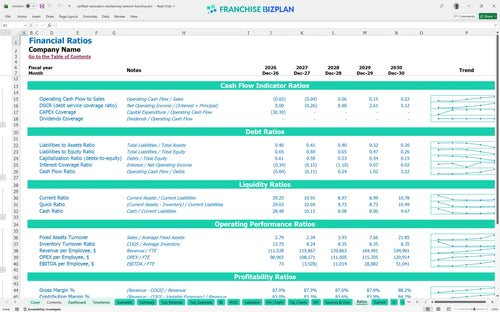
Performance metrics benchmark
We built this franchise unit profit and loss template using researched data for the textile restoration sector. The model comes pre-loaded with a $725,000 year-one revenue target and specific costs like the $24,600 initial fee, all of which you can adjust to fit your local market conditions. This data-driven approach ensures your projections are rooted in the day-to-day realities of specialized cleaning operations.
Your restoration unit is projected to reach positive EBITDA in Year 3, hitting approximately $88,000. While Year 2 shows a small $26,000 loss during the ramp-up, the scaling of insurance claims and luxury garment services defintely drives the $459,000 profit seen by Year 5. Profitability is a marathon, not a sprint, in this industry.
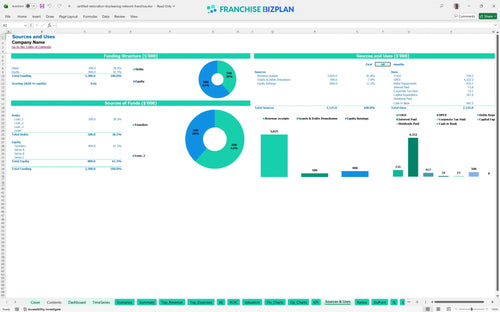
To launch this unit, you need a total initial investment of $507,600. This covers everything from your leasehold improvements to your first fleet of emergency vehicles, ensuring you have the startup financial projections for service-based franchises needed for a clean start. You can't restore a home if you can't fund the van.
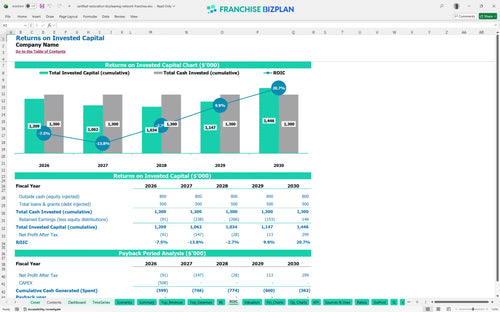
When calculating ROI for franchise business investment, this model shows an IRR of 0.4% and an ROE of 0.18. The payback period extends beyond the five-year mark, which is common for heavy CAPEX models requiring significant specialized machinery and facility fit-outs. Patience is required when your assets are this specialized.
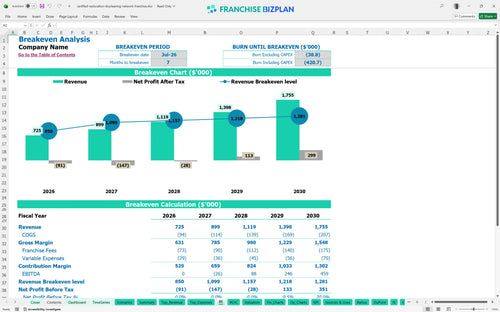
The unit hits its monthly break-even point in July 2026, just 7 months after launch. This Excel template for franchise unit financial forecasting shows that success depends heavily on the volume of insurance claim restorations, which represent your largest revenue stream. Seven months to break-even is a fast start for a heavy-lift business.
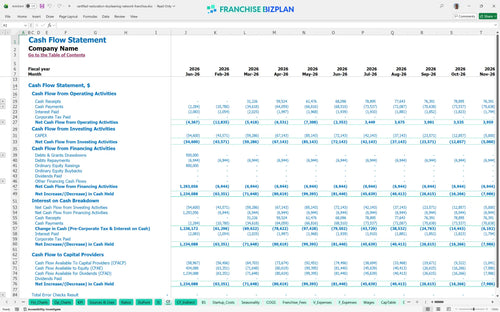
The lowest cash point occurs in December 2028 at $555,000, suggesting you need a significant capital buffer. Budgeting for a disaster recovery franchise unit requires careful oversight of the $9,500 monthly rent and the $18,000 initial chemical inventory to maintain liquidity. Cash is oxygen; don't hold your breath during the ramp-up.
Financial planning for new franchise owners must account for market volatility. This franchise financial feasibility study template lets you toggle between scenarios to see how a 10% drop in insurance claims impacts your Year 3 EBITDA or your peak cash requirement. Planning for the worst makes the best-case scenario even better.
Finance: update unit break-even and payback model by Friday
This franchise financial model template provides a professional Excel environment to test your assumptions. You can edit every formula and input to match your specific territory, from local labor rates to specific lease terms in your market. One bad formula can ruin a projection, so we kept the logic clean.

Map out your textile restoration business plan with detailed 5-year projections. This tool handles operational expense forecasting, allowing you to see how scaling from one to five technicians impacts your bottom line over the long term. Five years is a long time in restoration, but you need the map.

This franchise investment analysis tool simplifies the franchise royalty fee calculation by automating the 9% royalty and 1% marketing fund logic. You will see exactly how these top-line deductions affect your monthly take-home pay. Royalties are the price of the brand, but they must be managed.

Accurately estimating restoration business startup costs is the first step to avoiding a cash crunch. The model calculates your total initial investment and identifies the exact sales volume needed to cover your $9,500 monthly rent and other fixed costs. Knowing your floor is better than guessing your ceiling.

Use this business valuation spreadsheet to compare your projected margins against industry standards. It helps you verify if your 10.5% chemical cost assumption is realistic or if your labor-to-revenue ratio is out of alignment with top-performing units. Benchmarks keep your ego in check and your bank account full.


Simply purchase and download the financial model template, then access it instantly using Microsoft Excel or Google Sheets. No installation or technical expertise required-just open and start working.

Enter your business-specific numbers, including revenue projections, costs, and investment details. The pre-built formulas will automatically calculate financial insights, saving you time and effort.

Leverage the investor-ready format to confidently showcase your financial projections to banks, franchise representatives, or investors. Impress stakeholders with clear, data-driven insights and professional reports.

Leverage the investor-ready format to confidently present your projections to banks, franchise representatives, or investors.