
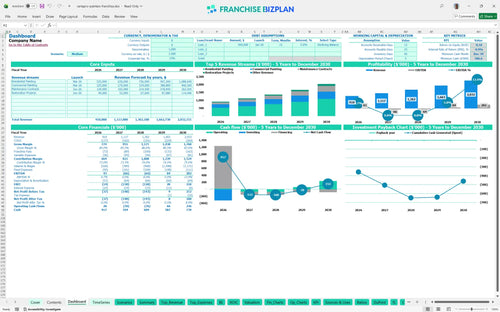
All-in-one Dashboard
Core inputs and core outputs


This Excel spreadsheet for franchise unit financial planning includes dynamic revenue drivers, detailed payroll modules, and automated financial statements for a professional painting business.
Core inputs and core outputs
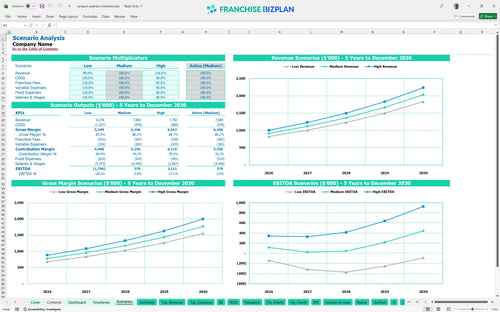
Three scenario analysis
Presentation ready
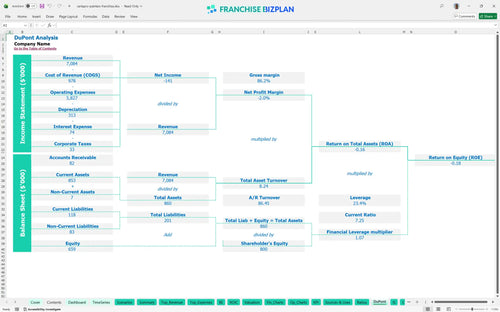
DuPont analysis
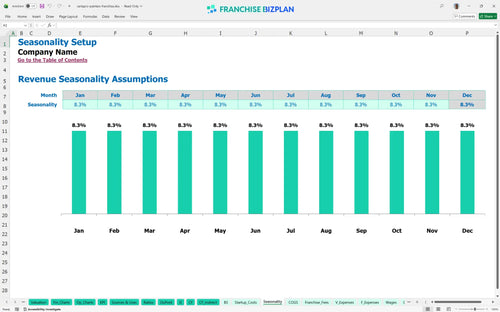
Researched revenue assumptions
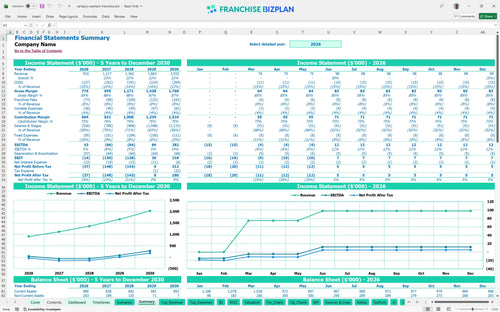
Lender-friendly financial outputs
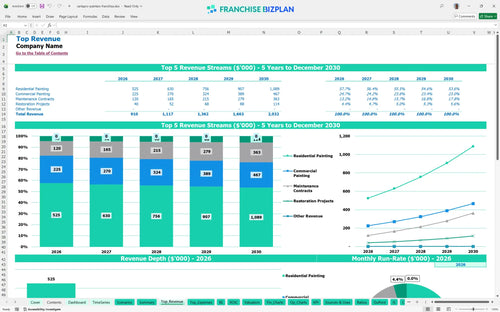
Revenue stream detailed view
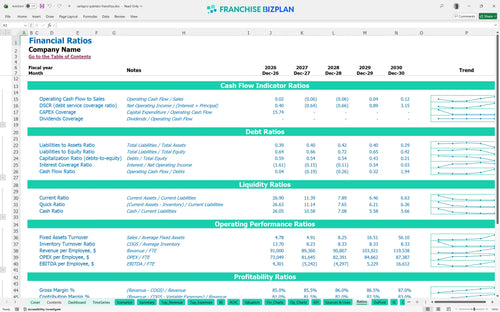
Performance metrics benchmark
We built this franchise unit financial model using detailed research into the home services sector and standard franchise disclosure documents. The pre-populated data includes four distinct revenue streams and a full staffing plan, showing a year-one revenue target of $910,000. All assumptions, from the $5,000 monthly rent to the 6% royalty, are fully editable to match your specific territory and local market demand.
The unit shows an initial EBITDA of $43,000 in year one, but faces a dip into negative territory during years two and three as you scale the team. True sustained profitability returns in year four with $84,000 in earnings, climbing to $282,000 by year five. This trajectory reflects the heavy cost of adding project managers and lead painters to support a $2 million revenue run rate. Scaling a service business often requires spending ahead of the next growth leg.
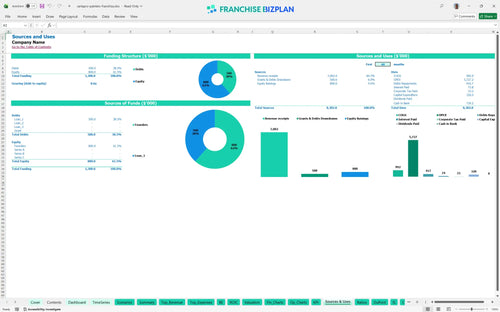
You will need approximately $320,000 in initial capital to cover the primary startup costs and equipment for this unit. This investment covers the $65,000 franchise fee, a $90,000 fleet of service vehicles, and $50,000 for office leasehold improvements. Plus, you should maintain a cash buffer to handle the ramp-up phase where payroll for your six-person initial crew will outpace early collections. Proper capitalization is the difference between growth and a stalled launch.
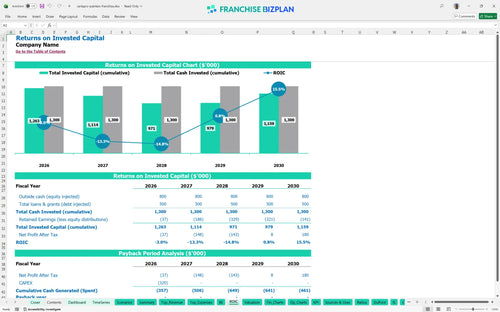
The financial model shows an Internal Rate of Return (IRR) of -0.91% over the first five years, with a full payback occurring after the five-year mark. While the year-five EBITDA is strong at $282,000, the high initial investment and mid-term scaling losses extend the recovery period for your equity. This model is built for a long-term operator looking to build a multi-million dollar asset rather than a quick flip. Patience is a requirement for this specific capital structure.
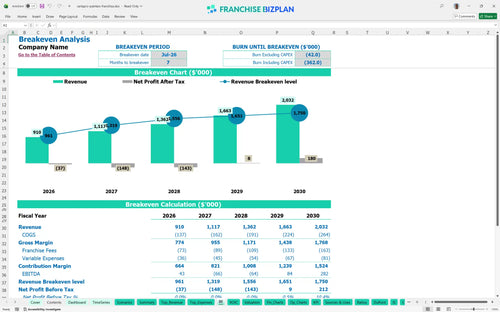
The unit reaches its monthly break-even point in July 2026, roughly seven months after the initial launch. Your ability to hit this mark depends heavily on the performance of the residential painting segment, which is projected to contribute $350,000 in its first year. Fixed costs, led by an $85,000 general manager salary and $5,000 monthly rent, create a high floor that requires consistent project volume to cover. High-ticket jobs are the fastest way to clear your fixed overhead.
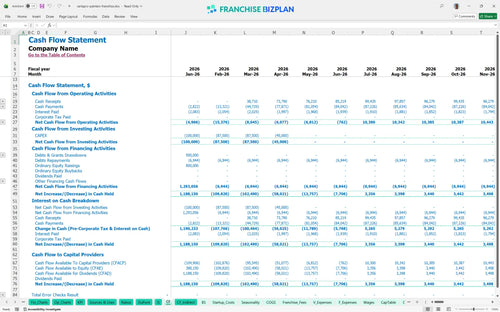
The lowest cash point is projected for December 2029, with a minimum cash balance of $587,000, assuming you start with significant working capital. You need a deep runway because the model shows EBITDA losses in years two and three as you aggressively hire painters and project managers. To protect your liquidity, you must watch the timing of vehicle acquisitions and ensure your accounts receivable (unpaid customer invoices) don't bloat. Cash is king when you are managing a large field team.
Moving from a medium to a high-growth scenario hinges on your ability to scale the residential and commercial painting segments simultaneously. In the high case, hitting a $2 million revenue target by year five significantly improves the ROI, but it requires managing a team of eight painters and four lead painters. If revenue lags by just 10%, the negative EBITDA years will deepen, requiring even more capital to keep the doors open. Execution at the local level determines which scenario becomes your reality.
Finance: update unit break-even and payback model by Friday
This painting franchise financial model is a fully editable Excel tool designed to handle the specific unit economics of a high-volume service business. You can adjust every assumption from local labor rates to material costs, allowing you to simulate different growth paths and market conditions. It defintely simplifies complex forecasting by providing a structured environment where formulas are already set, so you just plug in your local territory data.

Planning for a painting company startup costs requires a long-term view that goes beyond the first year of operations. This model provides a comprehensive 5-year outlook, tracking revenue growth from $910,000 in year one to over $2 million by year five. It maps out the transition from a single-crew setup to a multi-vehicle operation, ensuring you see the impact of scaling on your bottom line. Long-term visibility is the only way to manage a multi-unit expansion plan effectively.

Operating within a franchise system means managing specific financial obligations like a 6% royalty and a 2% marketing fund contribution. This painting franchise business plan template automatically calculates these fees based on your gross sales, showing exactly how much cash leaves the business before you pay your local bills. It ensures you account for every dollar owed to the brand, which is critical for maintaining your franchise agreement and understanding true store-level margin.

Estimating profitability for residential painting franchise units starts with a clear picture of your total initial cash outlay. This model breaks down startup costs, including the $65,000 franchise fee and $90,000 for service vehicles, to help you determine your total capitalization needs. By comparing these fixed startup costs against your expected contribution margin (the profit left after variable costs), you can pinpoint the exact sales volume needed to reach break-even. Knowing your numbers early prevents mid-ramp-up cash crunches.

The model uses built-in benchmarks for commercial painting franchise operations to help you sanity-check your projections against industry standards. For example, it tracks paint and materials as a percentage of sales, starting at 12% and scaling down to 10% as you gain purchasing power. These benchmarks act as a guardrail, ensuring your labor and occupancy costs stay within a range that supports healthy store-level EBITDA (earnings before interest, taxes, depreciation, and amortization). If your numbers deviate too far from these norms, the model flags it for review.


Simply purchase and download the financial model template, then access it instantly using Microsoft Excel or Google Sheets. No installation or technical expertise required-just open and start working.

Enter your business-specific numbers, including revenue projections, costs, and investment details. The pre-built formulas will automatically calculate financial insights, saving you time and effort.

Leverage the investor-ready format to confidently showcase your financial projections to banks, franchise representatives, or investors. Impress stakeholders with clear, data-driven insights and professional reports.

Leverage the investor-ready format to confidently present your projections to banks, franchise representatives, or investors.