
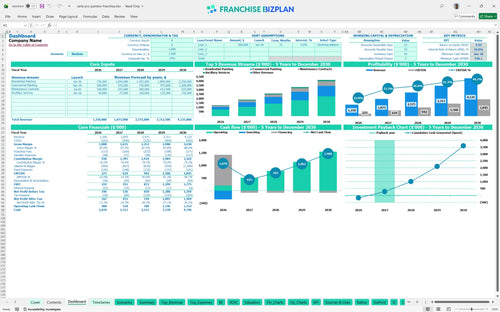
All-in-one Dashboard
Core inputs and core outputs


This franchise unit financial model template provides a professional-grade Excel framework to forecast revenue, manage expenses, and calculate total investment for a painting territory.
Core inputs and core outputs
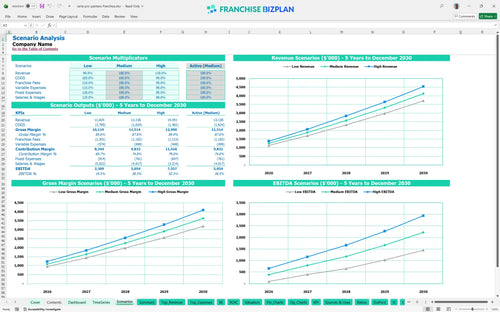
Three scenario analysis
Presentation ready
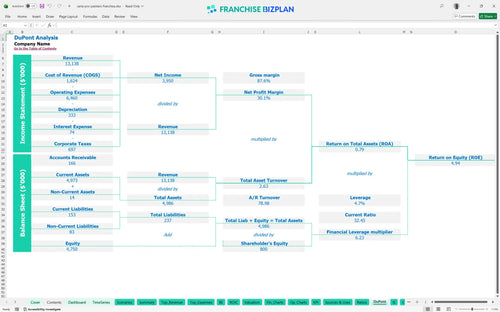
DuPont analysis
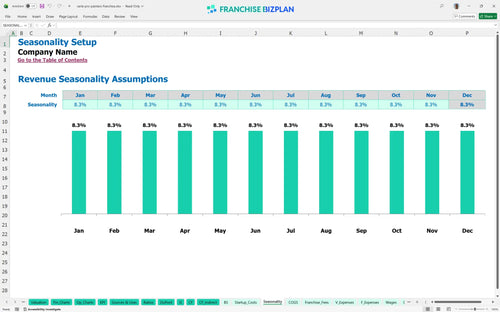
Researched revenue assumptions
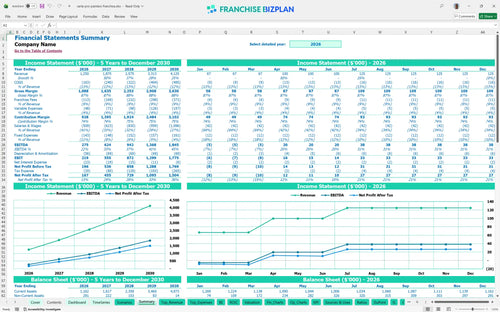
Lender-friendly financial outputs
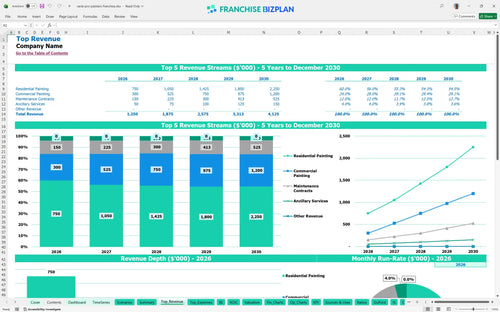
Revenue stream detailed view
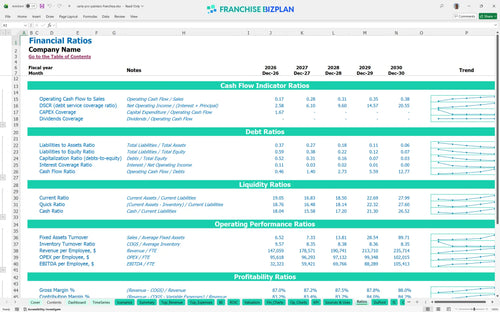
Performance metrics benchmark
We built this franchise unit financial model using our own research to provide a realistic painting contractor business model. Key assumptions like the 6% royalty, $347,000 initial investment, and $1.25M year-one revenue are pre-populated and fully editable. This tool helps you visualize how scaling to 10 painters drives a $1.8M EBITDA by year five.
Based on the data, this unit hits break-even in month one and generates $275,000 in EBITDA during its first year. Profitability depends on maintaining a tight 11% paint cost and managing the $95,000 GM salary against growing residential volume. By year two, net profit scales significantly as you move past the initial investment phase.
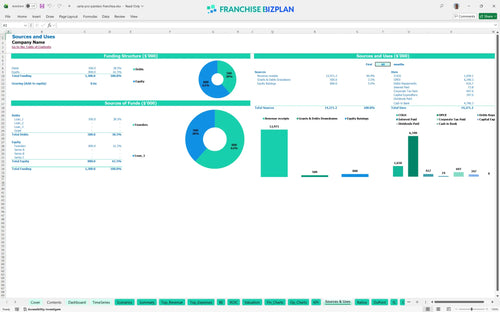
You need approximately $347,000 to get the doors open and the trucks on the road. This covers the $65,000 franchise fee, $80,000 for fleet vehicles, and $75,000 for the operations center build-out. The model also accounts for $15,000 in initial inventory and $20,000 in training to ensure your crews are ready for 'white-glove' service.
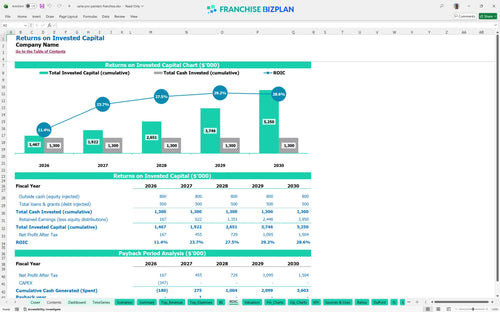
The model projects an Internal Rate of Return (IRR) of 10.02% with a full payback of your initial capital within 2 years. While the ROE is 4.94%, the real value is in the cash flow, which grows from $275k to $1.8M over five years. This painting franchise investment return analysis shows a stable, high-volume model for operators who can manage scale.
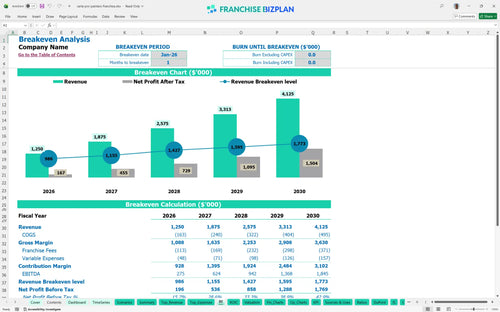
The unit is designed to break even almost immediately, with the data showing a one-month timeline to cover fixed costs. The primary driver for this is the low fixed overhead relative to the high average ticket of luxury residential painting. To stay above water, you must manage the $12,450 in monthly fixed costs, including rent and insurance, through consistent lead flow.
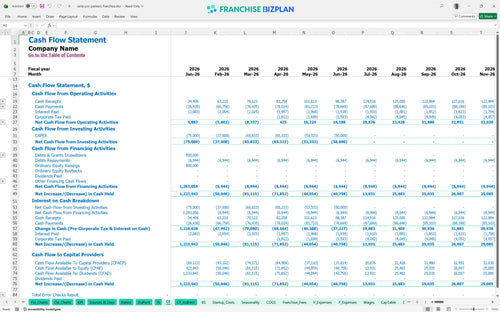
The lowest cash point occurs in June 2026, with a minimum cash need of $936,000 to maintain operations and cover the ramp-up. This suggests you need a significant liquidity buffer to handle the timing gap between paying painters and receiving final payments on large commercial contracts. Honestly, having a line of credit ready for that mid-year dip is a smart move for any new owner.
Moving from a medium to a high-growth scenario can push your year-5 revenue toward the $4.1M mark, but it requires scaling from 4 to 10 painters. A low-revenue scenario might delay your 2-year payback and tighten the year-1 EBITDA margin. The model allows you to stress-test how a 10% increase in paint costs or a dip in commercial volume affects your peak cash need.
This Excel-based tool lets you swap out every assumption to match your specific territory, from local labor rates to regional paint costs. You can adjust the 11% paint supply expense or tweak the $7,500 monthly rent to see how it shifts your bottom line. It is defintely built for the person who wants to see the 'what-if' before signing the FDD (Franchise Disclosure Document).

Scaling from $1.25M in year one to over $4.1M by year five requires a roadmap that accounts for more than just top-line sales. This model tracks your EBITDA growth from $275,000 to $1.8M, ensuring you have the cash to hire the 10 painters needed by year five. It maps out the transition from a hands-on owner to a multi-crew operation with dedicated project managers.

Royalties and brand funds are the 'tax' on your gross sales that can squeeze margins if you aren't careful. This model bakes in the 6% royalty and 3% marketing fee automatically across all revenue streams, including residential and commercial painting franchise business model projections. By seeing these costs upfront, you can price your jobs to protect your store-level margin after the franchisor takes their cut.

Launching requires roughly $347,000 in upfront capital, covering everything from the $65,000 franchise fee to the $80,000 fleet of vehicles. This model identifies exactly when you stop burning cash and start keeping it, which is crucial for a painting franchise business plan. With high-margin residential work starting day one, the math shows a path to breaking even in just one month if you hit the ground running.

Don't guess if your 11% paint supply cost is 'normal'-use the built-in benchmarks to verify your painting business financial projections. The model compares your labor spend and $7,500 rent against industry standards for high-end service territories. This sanity check helps you spot 'margin leaks' before they become permanent fixtures in your profit and loss statement.


Simply purchase and download the financial model template, then access it instantly using Microsoft Excel or Google Sheets. No installation or technical expertise required-just open and start working.

Enter your business-specific numbers, including revenue projections, costs, and investment details. The pre-built formulas will automatically calculate financial insights, saving you time and effort.

Leverage the investor-ready format to confidently showcase your financial projections to banks, franchise representatives, or investors. Impress stakeholders with clear, data-driven insights and professional reports.

Leverage the investor-ready format to confidently present your projections to banks, franchise representatives, or investors.