
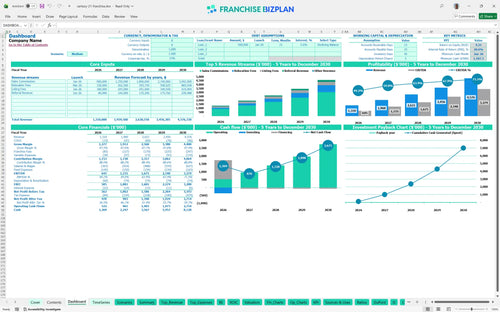
All-in-one Dashboard
Core inputs and core outputs


This real estate brokerage P&L template provides a complete roadmap for a brokerage, covering everything from initial fees to five-year cash flow forecasts.
Core inputs and core outputs
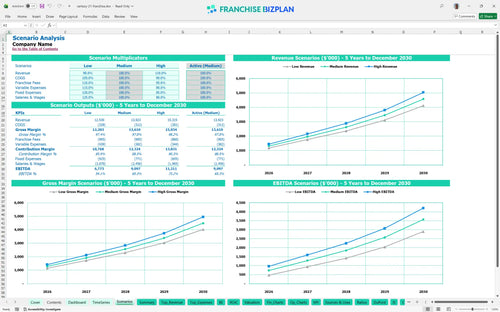
Three scenario analysis
Presentation ready
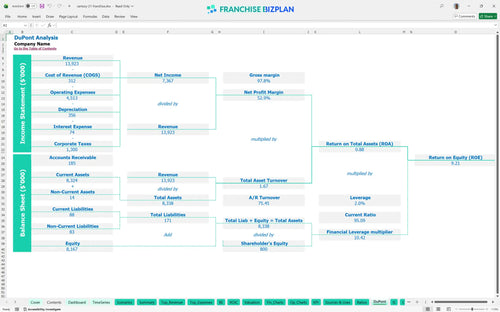
DuPont analysis
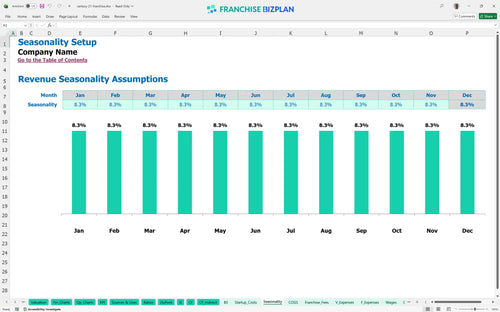
Researched revenue assumptions
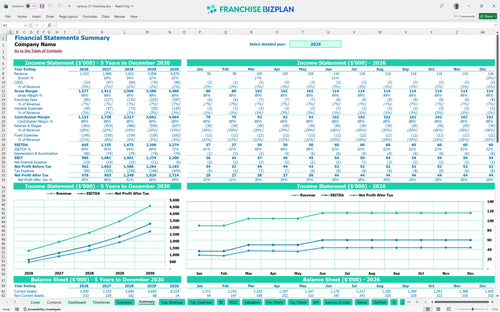
Lender-friendly financial outputs
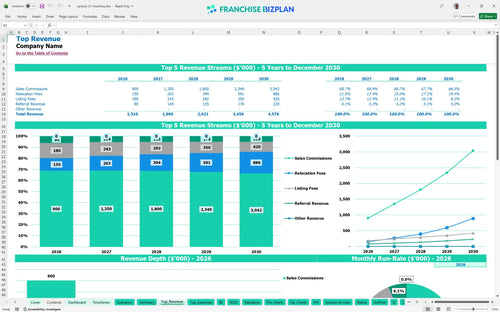
Revenue stream detailed view
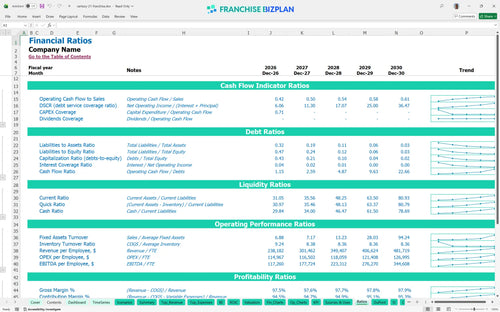
Performance metrics benchmark
We built this franchise unit financial model using extensive research on brokerage operations and high-growth market trends. Key assumptions, including sales commissions starting at $600,000 and scaling to $2.02 million, are pre-populated with researched data and are fully editable. This model tracks everything from $8,000 monthly rent to the 6.5% total franchise fee burden to ensure your unit economics work in the real world.
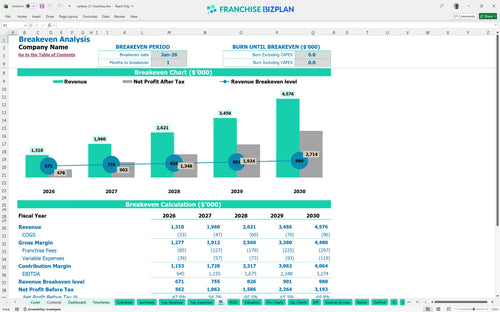
The unit reaches profitability almost immediately, with a break-even date of January 2026. Year 1 EBITDA starts strong at $645,000 and scales to $3.27 million by Year 5 as revenue grows from commissions and relocation fees. While monthly profits are high, the heavy initial investment means your total payback happens after the five-year mark. Year 1 EBITDA starts strong at $645,000.
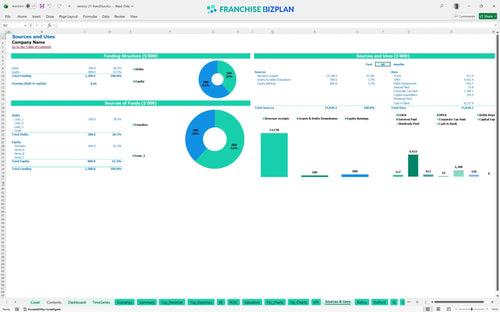
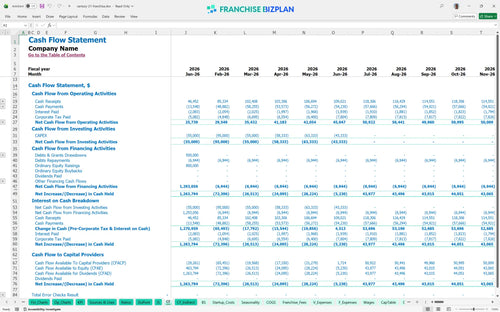
You need a substantial minimum cash position of $1.107 million to safely launch and ramp this operation. This covers the $25,000 franchise fee, $180,000 in build-out costs, and a significant cash buffer to handle the June 2026 low point. Most of your capital goes into the physical office and high-end tech.
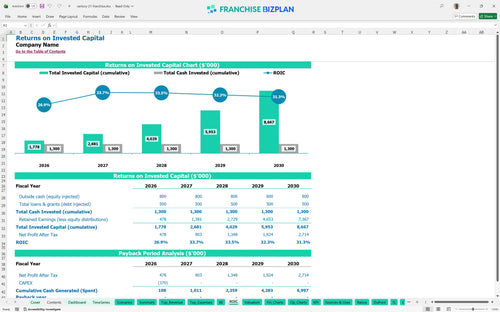
Investors can expect an Internal Rate of Return (IRR) of 20.59% and a Return on Equity (ROE) of 9.21%. While the franchise investment return is steady, the payback period extends beyond year five due to the high initial startup costs and office build-out. Still, the scaling EBITDA suggests a very valuable asset by year five.
The model shows a break-even in just one month, which is exceptionally fast for a brokerage. This depends heavily on hitting the $600,000 Year 1 commission target and managing the $8,000 monthly rent. If sales volume dips 10%, fixed costs will put immediate pressure on margins.
Your lowest cash point occurs in June 2026, roughly six months after launch. You will need a $1.107 million liquidity cushion to survive the initial heavy CAPEX spend and the ramp-up of agent productivity. You'll want an extra 15% in working capital just to be safe.
In a High scenario where revenue beats targets by 20%, your Year 1 EBITDA could jump significantly, accelerating your ROI projections for real estate brokerage investment. Conversely, a Low scenario with a 15% revenue drop might push your break-even back and increase your peak cash need. The model lets you toggle inputs to see how sensitive your net profit is.
This real estate franchise financial model Excel template lives in a spreadsheet, giving you total control over every line item. You can swap out the $8,000 monthly rent or adjust the real estate commission structure to see how they impact your bottom line. It is built to handle the specific nuances of a brokerage, from desk fees to tiered royalty structures. One wrong assumption in your staffing plan can sink your margins fast.

Mapping out a five-year horizon is vital for any business unit financial modeling. This franchise startup cost template tracks your climb from $1.31 million in year one to over $4.5 million by year five. It accounts for the scaling of your sales team, moving from 1.5 to 5.5 full-time agents as your local market share grows. Financial forecasting for residential real estate brokerage helps you spot when to reinvest in new tech. Planning for the long haul helps you spot when to reinvest.

Managing a 6% royalty and a 0.5% marketing fee requires precise tracking to protect your net margin. This real estate brokerage business plan calculates these franchise royalty fees automatically based on your gross commission income. At $1.31 million in annual sales, you are looking at about $85,150 in total franchise-related fees before you even pay your agents. Calculating franchise royalty and marketing fees correctly keeps your cash flow predictable.

Opening a tech-focused office requires significant upfront capital, including $180,000 for leasehold improvements and $40,000 for AI 3D tech. This financial projection spreadsheet for franchises helps you visualize the $370,000 in initial CAPEX needed before the doors open. How to calculate startup costs for a real estate franchise becomes simple when you map out the estimated costs for opening a tech-focused real estate franchise. The model shows a fast break-even, but that assumes your pipeline is ready.

We incorporated industry-standard ratios for labor and an operating expense forecast to keep your forecast grounded. For instance, your tech subscriptions are set at $950 monthly, which is typical for a modern, digital-first brokerage. If your professional fees or janitorial costs drift too far from these benchmarks, the model highlights the variance. It is a sanity check to ensure your profitability analysis for new real estate office remains realistic. This franchise profitability analysis ensures your margins stay within healthy ranges.


Simply purchase and download the financial model template, then access it instantly using Microsoft Excel or Google Sheets. No installation or technical expertise required-just open and start working.

Enter your business-specific numbers, including revenue projections, costs, and investment details. The pre-built formulas will automatically calculate financial insights, saving you time and effort.

Leverage the investor-ready format to confidently showcase your financial projections to banks, franchise representatives, or investors. Impress stakeholders with clear, data-driven insights and professional reports.

Leverage the investor-ready format to confidently present your projections to banks, franchise representatives, or investors.