
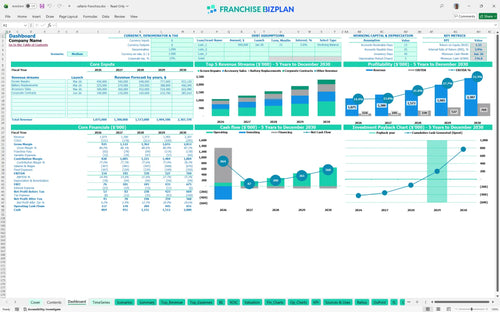
All-in-one Dashboard
Core inputs and core outputs


This franchise financial model template provides a complete toolkit for analyzing unit-level economics, including five-year projections, startup costs, and break-even analysis.
Core inputs and core outputs
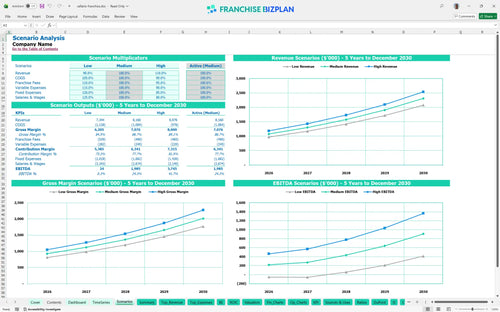
Three scenario analysis
Presentation ready
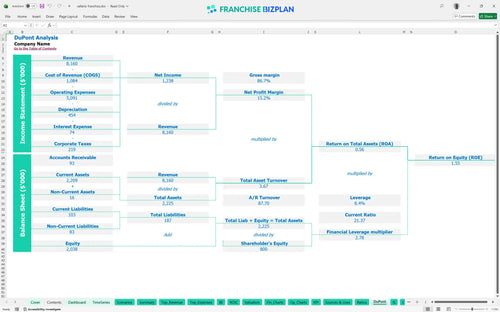
DuPont analysis
Researched revenue assumptions
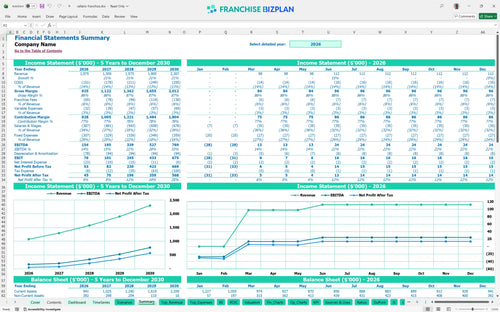
Lender-friendly financial outputs
Revenue stream detailed view
Performance metrics benchmark
We built this franchise unit financial model using our own research into the tech repair sector. Key assumptions like the $1,075,000 year-one revenue and $154,000 EBITDA (earnings before interest, taxes, depreciation, and amortization) are pre-populated with researched data specific to this tech repair franchise unit and are fully editable. This Excel template for mobile repair store financial planning and financial modeling for tech repair and accessory franchises covers everything from the $25,000 franchise fee to the $18,000 monthly rent.
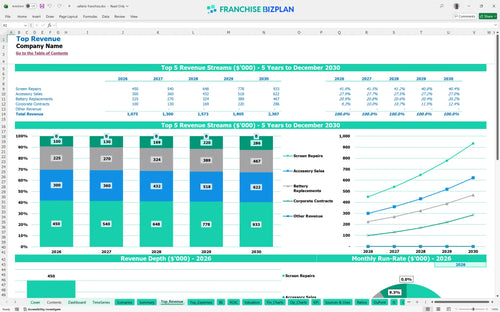
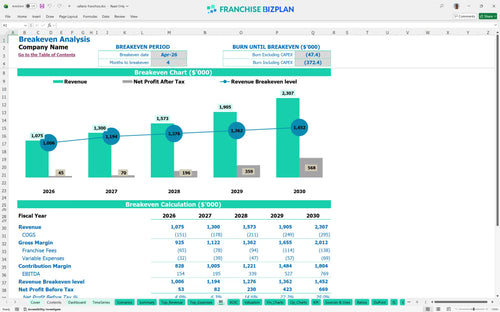
This franchise unit becomes profitable in month 4, reaching a $154,000 EBITDA in its first full year. This retail franchise profitability analysis and franchise profitability analysis for service-based businesses shows that high-margin screen repairs, which start at $300,000 in annual volume, are the primary engine for your bottom line. It defintely helps to focus on these high-ticket repairs early on to cover your fixed costs. Here is the quick math: reaching break-even fast reduces your total risk significantly.
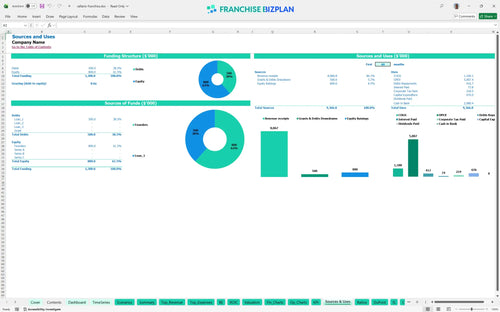
You need a total capital outlay of approximately $470,000 to get the doors open and the lights on. This franchise startup cost calculator shows the biggest hits are the $200,000 for leasehold improvements and $80,000 for specialized repair equipment. When learning how to calculate startup costs for a retail franchise, you must also include the $25,000 initial franchise fee and $25,000 for your first batch of inventory. What this estimate hides: the timing of your security deposit and utility hookups can impact your early cash flow.
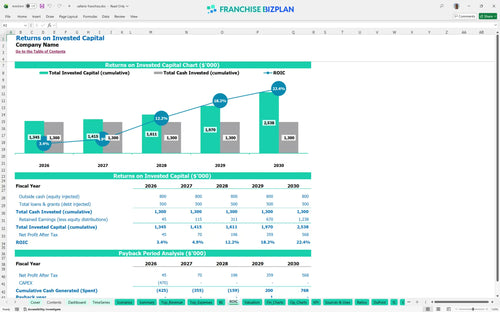
The franchise investment ROI (return on investment) is based on a 4-year payback period and a 3.89% internal rate of return (IRR). While the 1.55 return on equity (ROE) is the starting point, the real value is in the long-term cash flow which grows to a $769,000 EBITDA by year 5. This franchise investment analysis for prospective owners suggests that the model works best when you maintain high-traffic volume to leverage the fixed occupancy costs. Still, a 4-year payback is a solid benchmark for a premium retail location.
The break-even point for retail franchise locations occurs in month 4, provided you hit your early traffic targets. This franchise unit financial forecasting guide highlights that your $18,000 monthly rent and $75,000 manager salary are your biggest fixed hurdles. Estimating operating costs for a high-traffic retail location is vital because even a small dip in volume can push your break-even date further out. To be fair, your accessory sales at a 3.5% COGS (cost of goods sold) provide the best margin to reach that point faster.
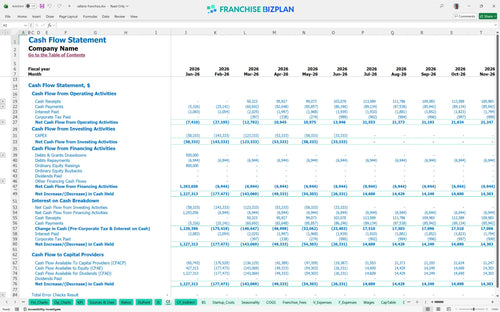
Your lowest cash point is $777,000 in June 2026, so you need to be careful with your initial runway during the ramp-up. Budgeting for franchise startup fees and inventory costs correctly ensures you don't run out of money before the corporate contracts revenue kicks in. We recommend keeping a tight grip on technician hiring, which scales from 3.0 to 5.0 FTE (full-time equivalent) staff, to protect your cash flow. If opening takes 90+ days longer than planned, your working capital pressure will rise quickly.
This franchise pro forma Excel (financial projection) allows you to toggle between Low, Medium, and High scenarios to see how your margins shift. In a high-performance scenario, your year-5 EBITDA could exceed $769,000 if you maximize the interactive customization kiosk and geofencing marketing. Knowing how to create a pro forma for a new franchise unit with these variables helps you prepare for the reality of fluctuating retail traffic. Finance: update unit break-even and payback model by Friday.
This franchise financial model template is built in Excel with fully editable assumptions and pre-filled formulas, allowing you to adapt the numbers to any specific territory or retail footprint. You can easily adjust the $18,000 monthly rent or the $75,000 manager salary to see how local market conditions impact your bottom line. Every revenue driver and cost category is open for modification, so you aren't stuck with a static document. One point of margin leak can sink a single-unit model, so precision here is everything.

This small business financial projection template provides a clear roadmap from your first repair to year five, helping you visualize how revenue scales from $1,075,000 to over $2.3 million. We include detailed views of your profit and loss, cash flow, and balance sheet to ensure you stay ahead of your capital needs. Business plan forecasting is about more than just top-line growth; it is about seeing the timing gaps between opening costs and mature-unit performance. The model helps you track how your store-level margin evolves as you add more technicians.

Managing your franchise unit economics requires a strict focus on the 5% royalty and 1% marketing fund contributions that come off the top of your gross sales. This model automatically calculates these ongoing obligations so you can see exactly how much cash is left for local overhead and debt service. If you are doing $100,000 a month, that is $6,000 going to the franchisor before you even pay your light bill. Understanding these fixed brand standards is the only way to protect your store-level EBITDA (earnings before interest, taxes, depreciation, and amortization).

Our franchise startup cost calculator breaks down the $470,000 capital expenditure budget (CAPEX), including the $200,000 leasehold improvements and $80,000 in repair equipment. You will see exactly how many screen repairs and battery replacements you need to sell each month to cover your retail store operating expenses. Break-even depends less on headline sales and more on your ability to manage the $18,000 monthly rent in a high-traffic location. Knowing your numbers on day one prevents the stress of unexpected cash calls during the ramp-up phase.

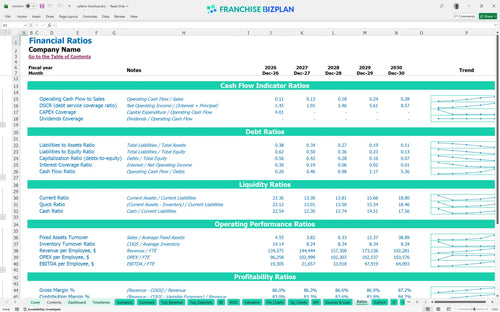
The model includes built-in benchmarks for the tech repair sector to help you sanity-check your labor costs and occupancy ratios. If your repair parts (COGS) are significantly higher than the 10.5% baseline, you know you have a waste or pricing problem that needs immediate attention. These benchmarks act as a guardrail, ensuring your pro forma stays grounded in the reality of high-volume retail operations. Comparing your performance against industry standards is the fastest way to identify a margin leak. Good data beats a gut feeling every single time.


Simply purchase and download the financial model template, then access it instantly using Microsoft Excel or Google Sheets. No installation or technical expertise required-just open and start working.

Enter your business-specific numbers, including revenue projections, costs, and investment details. The pre-built formulas will automatically calculate financial insights, saving you time and effort.

Leverage the investor-ready format to confidently showcase your financial projections to banks, franchise representatives, or investors. Impress stakeholders with clear, data-driven insights and professional reports.

Leverage the investor-ready format to confidently present your projections to banks, franchise representatives, or investors.