
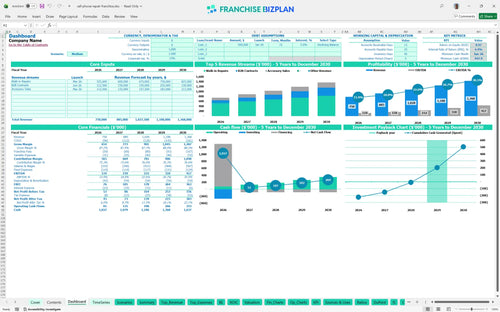
All-in-one Dashboard
Core inputs and core outputs


This comprehensive toolkit provides a cell phone repair franchise unit economics breakdown, covering everything from initial CAPEX to multi-year EBITDA targets and cash flow management.
Core inputs and core outputs
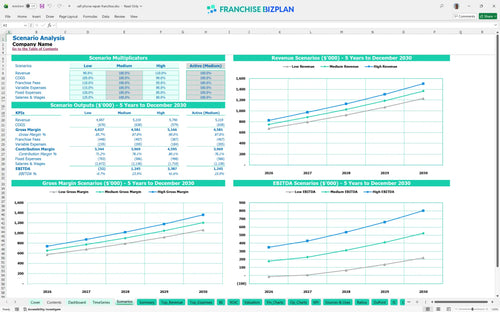
Three scenario analysis
Presentation ready
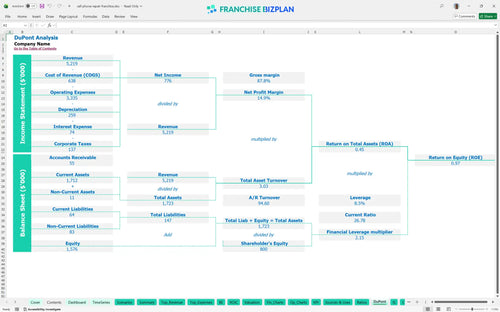
DuPont analysis
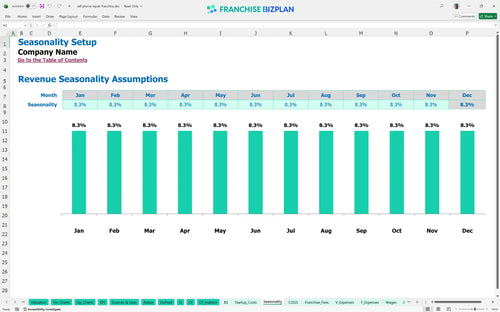
Researched revenue assumptions
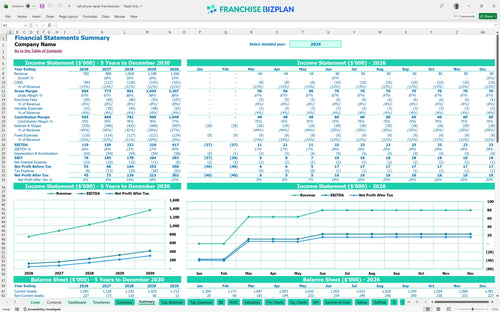
Lender-friendly financial outputs
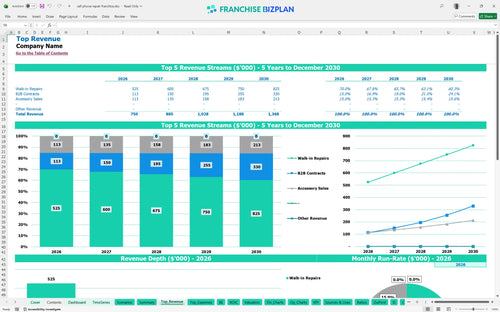
Revenue stream detailed view
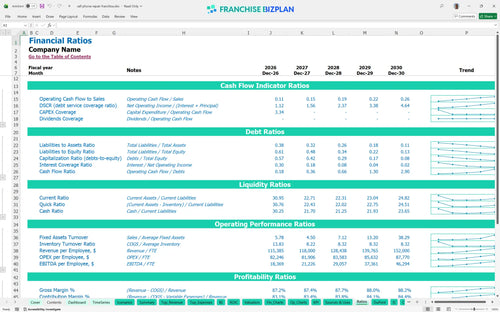
Performance metrics benchmark
We built this cell phone repair franchise financial model using our own research into retail electronics and mobile restoration trends. Key assumptions, including the $750,000 year-one revenue target and the 4-month sprint to break-even, are pre-populated with researched data and are fully editable to match your specific location. This provides a realistic starting point for any franchise investment feasibility study template.
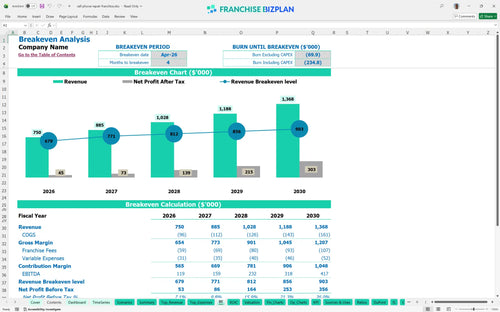
The model shows this unit hitting break-even by April 2026, just four months after opening. By year two, expect an EBITDA of $159,000 as B2B contracts for school districts and corporate fleets begin to stabilize the monthly revenue floor. Estimating revenue for phone repair service contracts is key to moving past the volatile early months.
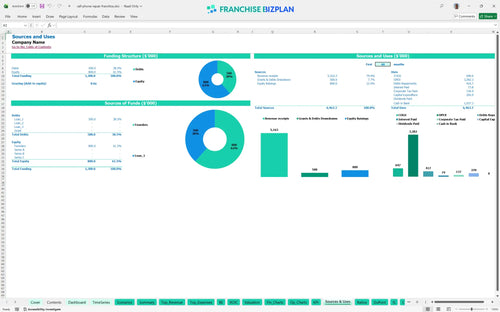
You will need significant capital to cover the $269,900 in initial hard costs plus a healthy cash buffer. The heaviest lifts are the $100,000 leasehold improvements and $70,000 for specialized workstations and diagnostic gear. This cell phone repair shop startup costs breakdown ensures you are not undercapitalized during the critical ramp-up phase.
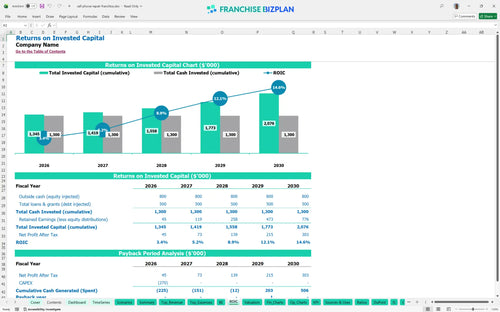
This model projects a 4-year payback period and an IRR (Internal Rate of Return) of 4.36%. While the initial return seems modest, the ROE (Return on Equity) of 0.97 and the jump to a $417,000 EBITDA by year five show the long-term value of the 'repair-while-you-shop' model. A thorough ROI analysis is essential for any financial model for multi-unit franchise expansion.
Monthly break-even happens in month 4, driven largely by the $5,500 prime location rent and the $19,833 monthly base payroll. To hit this, your walk-in repair volume needs to offset the 7.8% combined royalty and marketing burden. Analyzing recurring revenue in repair businesses through B2B contracts can significantly lower the risk of missing these targets.
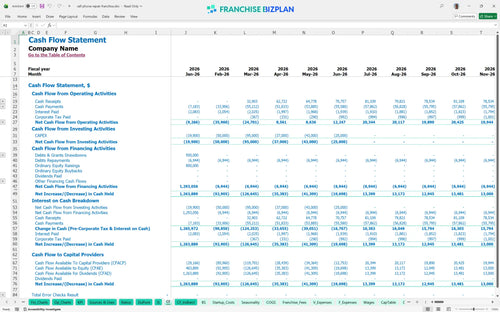
The lowest cash point hits in June 2026 at $948,000, suggesting you need deep pockets or solid financing to weather the initial build-out and ramp-up. Honestly, having a six-month cushion is vital when waiting for B2B accounts to pay their first invoices. This is a critical step when you learn how to create a franchise pro forma statement that reflects reality.
A cell phone repair business profit margin analysis shows that a 10% drop in walk-in traffic can delay payback by over a year. Conversely, hitting the high case through aggressive local marketing execution can push your year-5 EBITDA well past the $417,000 baseline. Scenarios help you prepare for both the quiet months and the high-growth periods.
Finance: update unit break-even and payback model by Friday.
This cell phone repair franchise financial model is a flexible Excel tool designed to handle your specific market variables. You can swap out rent, labor rates, or part costs to see how they impact your bottom line before signing a lease. It is a fully customizable franchise business plan template that adapts to your specific territory and local competition levels.

We mapped out a franchise unit financial projection from launch through year five to show the transition from a single-unit startup to a mature operation. At $750,000 in year one growing to $1,368,000 by year five, the model tracks how scaling B2B contracts and walk-in traffic shifts your margin profile. This helps you visualize the long-term retail franchise profitability analysis over a standard lease term.

Operating under a brand means 5.8% of every dollar goes to royalties and 2.0% to the marketing fund. This model ensures these franchise royalty fees are baked into your daily break-even so there are no surprises when the franchisor drafts your account. It simplifies the complex math of calculating how much top-line revenue actually stays in your pocket after brand obligations.

Knowing how to calculate startup costs for a repair franchise is the difference between a smooth opening and a cash crunch. With a $19,900 franchise fee and $100,000 in leasehold improvements, you need to know exactly when your $5,500 monthly rent becomes covered by repair volume. This section provides a clear view of your capital expenditure and the runway needed to reach sustainability.

Use this Excel template for retail franchise financial forecasting to compare your projected 11% parts cost against industry norms. We defintely included these targets so you can spot if your technicians are wasting inventory or if your 'transparent tech bar' is driving the expected upsell. It acts as one of the best financial planning tools for new franchise owners by providing a sanity check on your operating expenses.


Simply purchase and download the financial model template, then access it instantly using Microsoft Excel or Google Sheets. No installation or technical expertise required-just open and start working.

Enter your business-specific numbers, including revenue projections, costs, and investment details. The pre-built formulas will automatically calculate financial insights, saving you time and effort.

Leverage the investor-ready format to confidently showcase your financial projections to banks, franchise representatives, or investors. Impress stakeholders with clear, data-driven insights and professional reports.

Leverage the investor-ready format to confidently present your projections to banks, franchise representatives, or investors.