
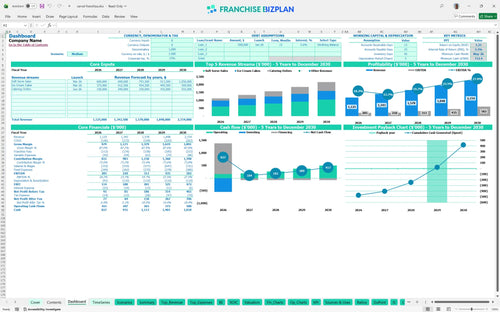
All-in-one Dashboard
Core inputs and core outputs


This franchise business plan Excel provides a complete unit economics model for tracking everything from initial build-out costs to five-year cash flow valuations.
Core inputs and core outputs
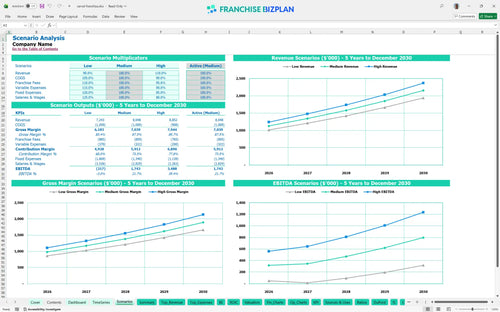
Three scenario analysis
Presentation ready
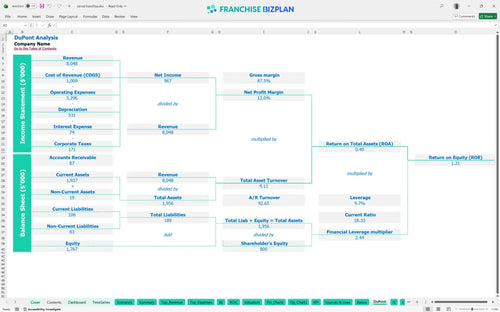
DuPont analysis
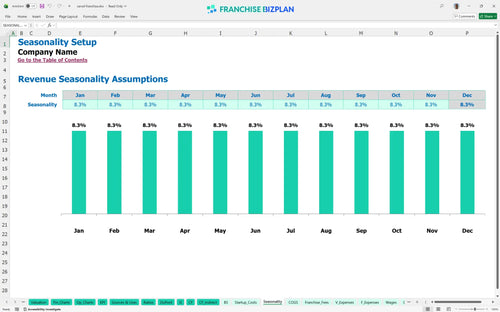
Researched revenue assumptions
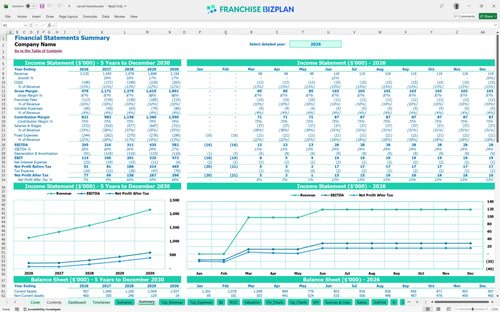
Lender-friendly financial outputs
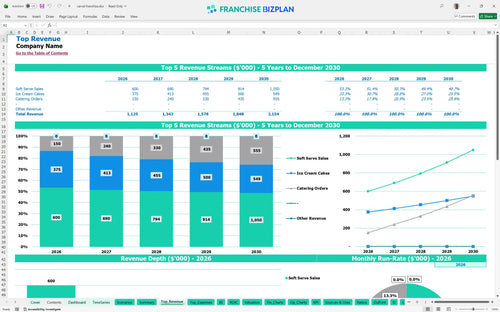
Revenue stream detailed view
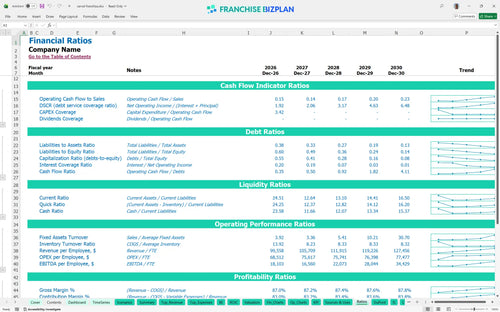
Performance metrics benchmark
We built this franchise unit financial model using our own research to ensure your projections are grounded in reality. Key assumptions like the $1,125,000 year-one revenue and $14,000 monthly rent are pre-populated with researched data and are fully editable. This tool helps you visualize how the 4-year payback period and 3.31% IRR actually play out in a high-traffic retail setting.
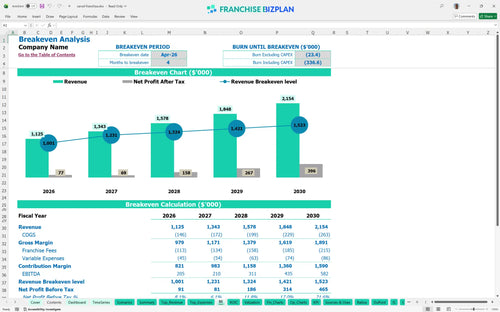
Based on the $1,125,000 year-one revenue target, the unit hits its stride quickly, showing positive EBITDA of $205,000 in the first year. After accounting for the 6% royalty and 12% dairy COGS, the model estimates the unit becomes profitable by April 2026. Here's the quick math: you need to maintain that $1.12M floor to cover the high fixed rent and management salaries.
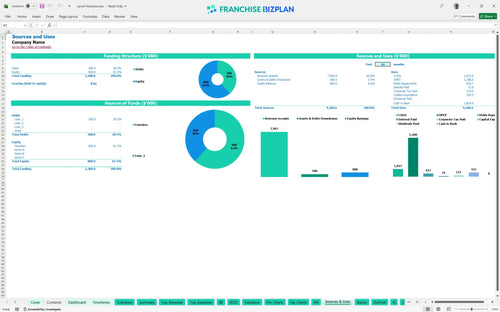
You'll need significant startup capital to secure a prime location and install specialized production gear. The total initial investment covers the $30,500 franchise fee, $280,000 in leaseholds, and $130,000 for soft serve and cake equipment, plus an opening cash buffer to handle the ramp-up. What this estimate hides is the potential for construction delays that could stretch your pre-opening burn.
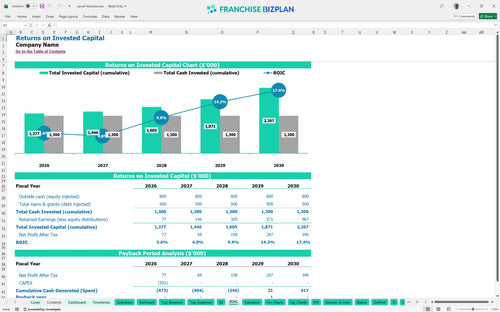
Estimating ROI for dessert franchise locations requires looking past the first year; this model shows a 4-year payback period. With an IRR of 3.31% and an ROE of 1.21, the long-term value sits in the steady cash flow climb to $582,000 EBITDA by year five. Still, your actual return depends heavily on maintaining the 12% dairy cost target as you scale volume.
The monthly operating budget template for franchises shows a break-even date in April 2026, just four months after launch. The primary driver is throughput-balancing the $14,000 fixed rent against high-volume soft serve sales and premium cake margins. If opening takes 90+ days longer than planned, working capital pressure rises quickly, so hitting that April target is critical.
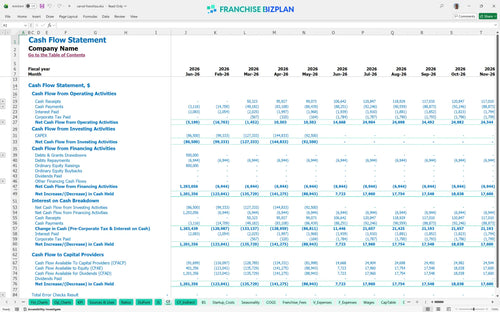
The lowest cash point hits in May 2026 at $712,000, meaning you need a solid liquidity cushion during the build-out and initial ramp. This cash flow projection template for small business franchises helps you monitor the gap between paying $35,000 for signage and seeing the first catering check. Honestly, keeping a 20% buffer over the minimum cash point is the safest move for a first-time operator.
Evaluating profitability of high-traffic retail franchise locations means testing what happens if sales drop 10% or labor spikes. A high-performance scenario accelerates the 4-year payback, while a low-revenue case might push the $712,000 cash floor even lower, requiring tighter expense management. Every 1-point margin leak matters fast when you are paying 10% in combined royalties and marketing fees.
This franchise financial model template is built in Excel, allowing you to tweak every assumption from soft serve mix costs to seasonal labor swings. It uses pre-filled formulas and a detailed operating expense breakdown so you can test different rent scenarios or local demand shifts without breaking the math. Using an Excel template for ice cream shop financial forecasting ensures you can adjust the $14,000 monthly rent or $65,000 manager salary to fit your specific market.

Map out your long-term trajectory with retail franchise financial projections that scale from $1.12M in year one to over $2.1M by year five. This financial model for retail food franchise expansion includes a franchise unit profit and loss statement example to track how scaling catering orders and cake volume impacts your bottom line over a 60-month window. It provides a clear view of your balance sheet and cash flow as you move toward a mature unit state.

Analyzing franchise royalty and marketing fund costs is vital since they eat 10% of your top line right off the bat. The model bakes in the 6% franchise royalty fees and 4% brand fund contributions, ensuring you see the true store-level margin after the franchisor takes their cut. This helps you understand the real economics of the $30,500 initial fee and ongoing obligations before you sign the agreement.

Use the break-even analysis calculator to figure out exactly when your scoop shop stops burning cash and starts keeping it. When learning how to calculate startup costs for a food franchise, you must account for ice cream franchise startup costs like $280,000 in leaseholds and $130,000 for equipment. Knowing your daily volume target is the only way to manage the initial investment and reach a sustainable margin.

We've integrated restaurant franchise profitability analysis standards and best practices for franchise financial modeling to help you defintely sanity-check your dairy spend and labor ratios. If your crew member costs or $14,000 monthly rent deviate from typical high-traffic retail norms, the model flags the risk immediately. This allows you to compare your projected gross margins against industry-standard ranges for dessert concepts.


Simply purchase and download the financial model template, then access it instantly using Microsoft Excel or Google Sheets. No installation or technical expertise required-just open and start working.

Enter your business-specific numbers, including revenue projections, costs, and investment details. The pre-built formulas will automatically calculate financial insights, saving you time and effort.

Leverage the investor-ready format to confidently showcase your financial projections to banks, franchise representatives, or investors. Impress stakeholders with clear, data-driven insights and professional reports.

Leverage the investor-ready format to confidently present your projections to banks, franchise representatives, or investors.