
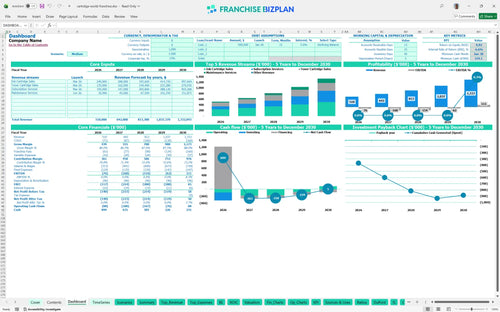
All-in-one Dashboard
Core inputs and core outputs


This comprehensive tool provides a detailed roadmap for managing the unit economics and long-term growth of a specialized printing supply and service business.
Core inputs and core outputs
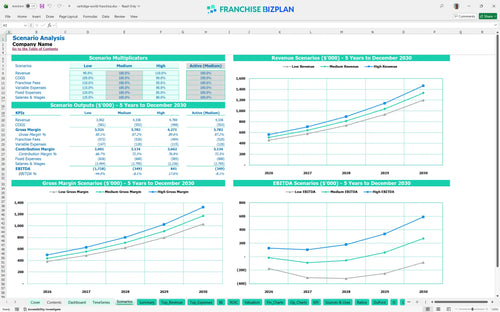
Three scenario analysis
Presentation ready
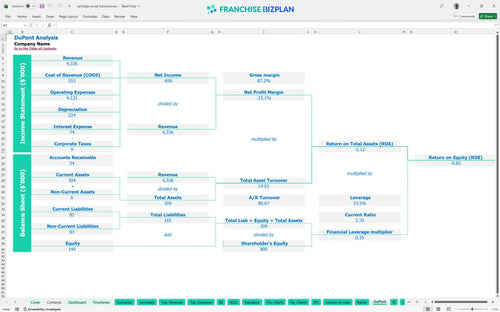
DuPont analysis
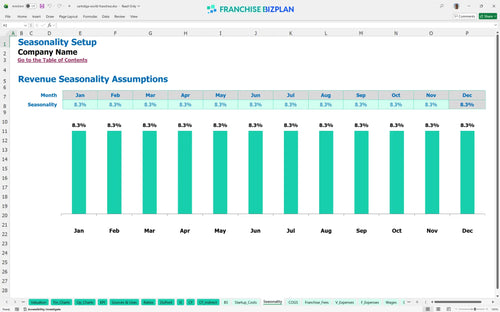
Researched revenue assumptions
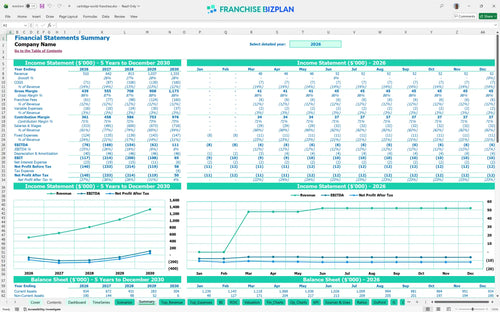
Lender-friendly financial outputs
Revenue stream detailed view
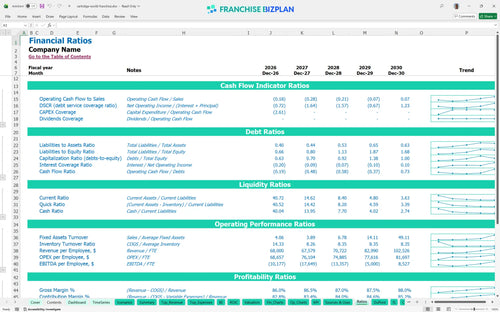
Performance metrics benchmark
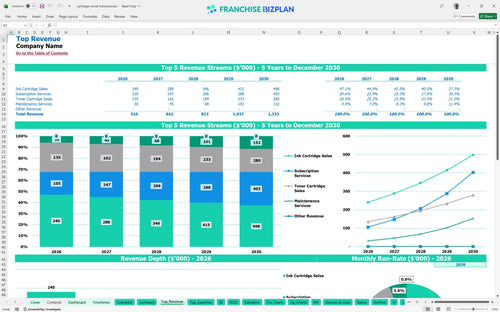
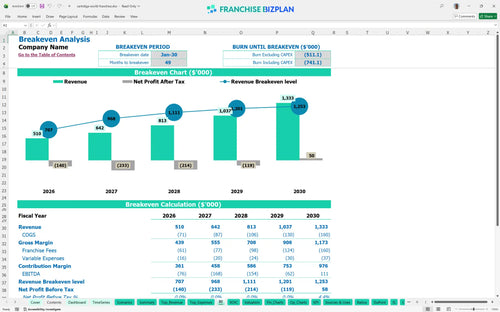
We built this financial model for printing and supply business units using detailed research into the ink and toner retail business sector. The model comes pre-populated with data for revenue streams like subscription services and maintenance, alongside franchise-specific costs like the $50,000 initial fee. With year one revenue starting at $510,000 and scaling toward $1,333,000, this tool helps you navigate the 49-month path to operational break-even.
Profitability for this unit is a long-game play, with EBITDA finally turning positive at $111,000 in year five. You will need to manage high labor costs and royalty burdens during the ramp-up years while your subscription revenue matures. Franchise profitability analysis shows that year five is the pivot point where the recurring revenue business model finally outpaces the fixed cost base. Analyzing profitability for cartridge retail franchise units requires looking past the early losses to the mature margin.
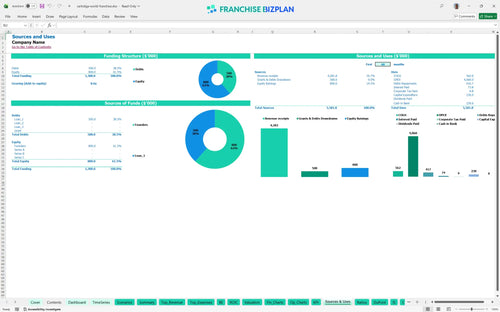
You will need approximately $230,000 in total initial capital to cover the startup budget template for service-based franchise requirements. This includes the $50,000 franchise fee, $65,000 for leasehold improvements, and $35,000 for specialized refilling equipment. How to calculate startup costs for a retail franchise becomes clear when you see the $15,000 initial inventory and $25,000 delivery vehicle costs laid out in the first few months.
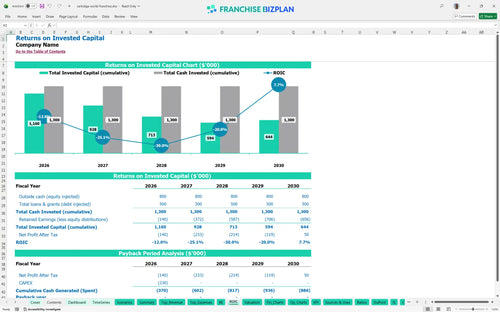
The franchise investment ROI calculator spreadsheet shows an IRR of -6.61% over the initial five-year period, with full payback occurring after year five. This small business P&L template highlights that while year five EBITDA is healthy at $111,000, the early heavy lifting in payroll and rent delays the total return. You are investing in a long-term asset where the value is built through B2B contract density and local market share.
The unit hits its monthly break-even point in January 2030, exactly 49 months after launch. Your break-even is heavily influenced by franchise operating expenses, specifically the 12% combined royalty and marketing fee. To shorten this window, you must focus on increasing the average ticket for B2B clients to offset the $6,500 monthly prime location rent.
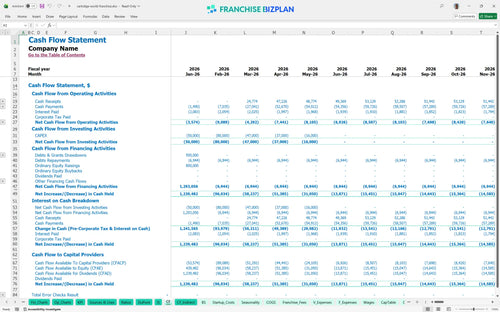
The lowest cash point is $219,000, which occurs in January 2030, meaning you need significant liquidity to weather the ramp-up. This best financial model for subscription-based franchise operations shows that cash flow is tightest just before the break-even month. You defintely need a solid cash buffer to handle the $270,000+ annual payroll for your sales and tech teams while revenue builds.
How to forecast revenue for a B2B service franchise depends on your ability to hit the high-growth scenario, which could pull the break-even date forward by 12 months. In a low-revenue scenario, the negative EBITDA in years one through four deepens, potentially requiring additional capital injections. The high-case scenario relies on aggressive B2B sales rep productivity and high retention in Austin's tech sector.
Finance: update unit break-even and payback model by Friday
This franchise financial model template is built in Excel to give you total control over your numbers. You can adjust pre-filled formulas and editable assumptions to match your specific territory, whether you are looking at a single shop or a multi-unit territory. It works as a high-level Excel template for franchise unit financial forecasting that scales with your ambition.

Planning for the long haul is the only way to survive in retail, so we built a business financial projection template that looks five years out. It tracks everything from your initial launch to mature-unit performance. This franchise unit economic performance template helps you see how scaling from $510,000 in year one to over $1.3 million by year five impacts your bottom line.

Franchise investment analysis requires a deep dive into the costs of staying in the system. This model accounts for the 8% royalty and 4% marketing fund contributions that come off the top of your gross sales. By automating these calculations, you can see exactly how much cash stays in the unit after the franchisor takes their cut.

Our franchise startup cost calculator helps you map out the initial capital needed before you open your doors. It includes everything from leasehold improvements to initial inventory, providing a clear path to your break-even point. Estimating operating costs for a local franchise store is easier when you can see the exact sales volume required to cover your $6,500 monthly rent and fixed overhead.

This retail franchise business plan includes researched benchmarks to help you sanity-check your local projections. We have included standard ranges for labor, rent, and COGS (Cost of Goods Sold) so you can see if your 12.5% material cost assumption is realistic. It is a reality check for your pro forma that keeps your expectations grounded in store-level facts.


Simply purchase and download the financial model template, then access it instantly using Microsoft Excel or Google Sheets. No installation or technical expertise required-just open and start working.

Enter your business-specific numbers, including revenue projections, costs, and investment details. The pre-built formulas will automatically calculate financial insights, saving you time and effort.

Leverage the investor-ready format to confidently showcase your financial projections to banks, franchise representatives, or investors. Impress stakeholders with clear, data-driven insights and professional reports.

Leverage the investor-ready format to confidently present your projections to banks, franchise representatives, or investors.