
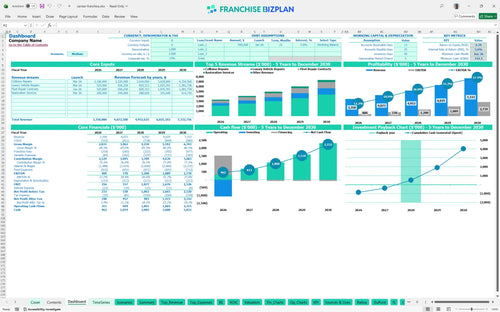
All-in-one Dashboard
Core inputs and core outputs


This comprehensive franchise unit financial model template provides a data-driven roadmap for planning, launching, and scaling a collision repair business.
Core inputs and core outputs
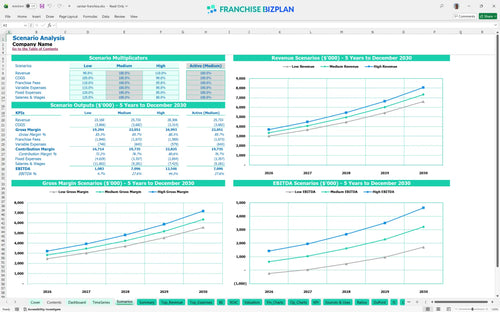
Three scenario analysis
Presentation ready
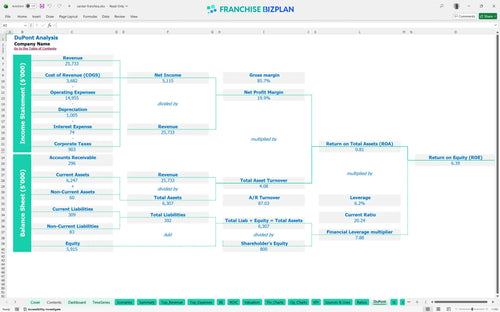
DuPont analysis
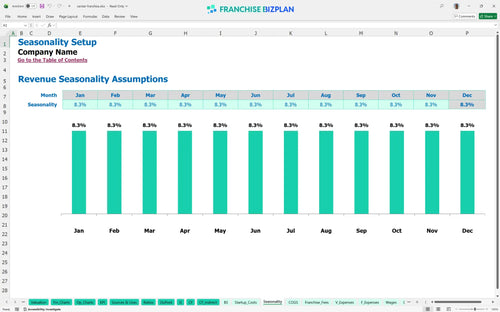
Researched revenue assumptions
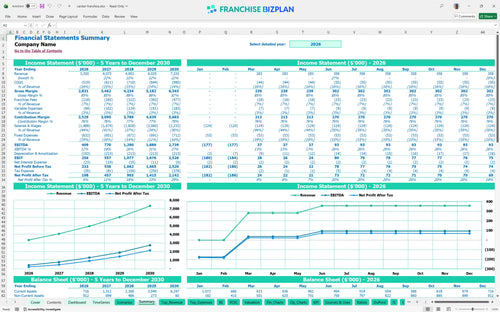
Lender-friendly financial outputs
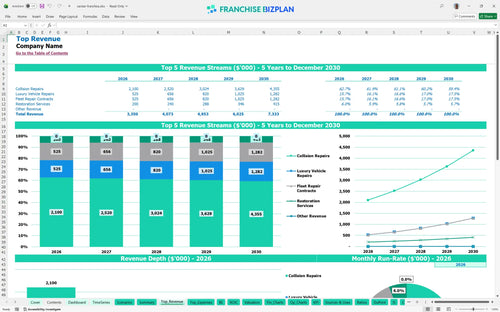
Revenue stream detailed view
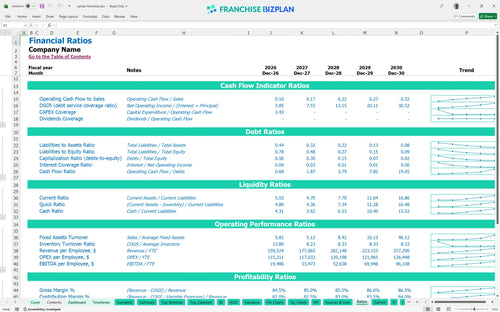
Performance metrics benchmark
We built this financial model for a collision repair franchise unit based on extensive research into industry standards and brand-specific requirements. All assumptions, including the $1.4M initial collision repair revenue and the 5.5% royalty structure, are pre-populated and fully editable to match your specific market conditions. Analyzing insurance repair revenue in auto body franchises requires this level of detail to ensure your cash flow remains positive during the ramp-up phase.
Based on the data, the unit reaches profitability in April 2026, just four months after launch. With Year 1 EBITDA projected at $409,000 and scaling to over $2.7M by Year 5, the model shows a strong upward trajectory as fleet contracts and luxury repairs ramp up. Estimating profitability for a new franchise location is much simpler when you have a structured auto body shop business plan.
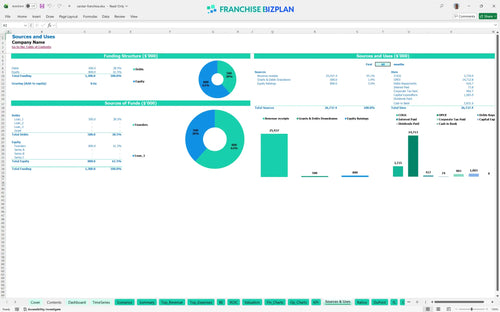
You will need significant startup capital requirements to cover the $350,000 leasehold improvements and $180,000 paint booth installation. The total collision repair franchise investment also accounts for a $10,000 franchise fee and $120,000 for frame machines, requiring a solid cash position before the first car enters the shop.
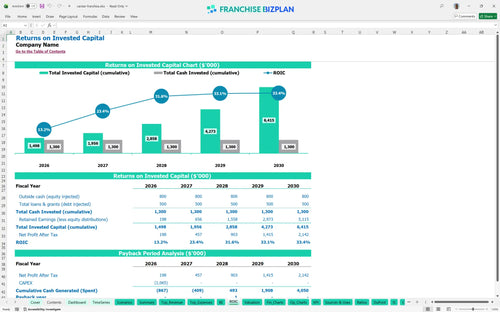
The model projects an Internal Rate of Return (IRR) of 5.65% and a Return on Equity (ROE) of 6.39%. While the initial returns are conservative, the three-year payback period is attractive for an asset-heavy business with high recurring revenue potential. This collision repair facility ROI analysis tool provides a clear return on investment calculation for stakeholders.
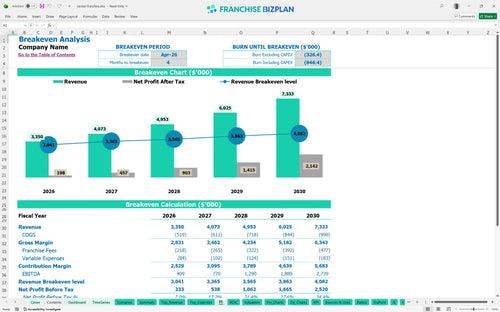
The shop hits its monthly break-even point in April 2026. The primary driver for this is the high fixed cost of rent at $28,000 and a large staff of 10 technicians, meaning throughput and average ticket size are critical to covering monthly overhead. Calculating recurring revenue for fleet service contracts is essential to stabilizing this break-even point.
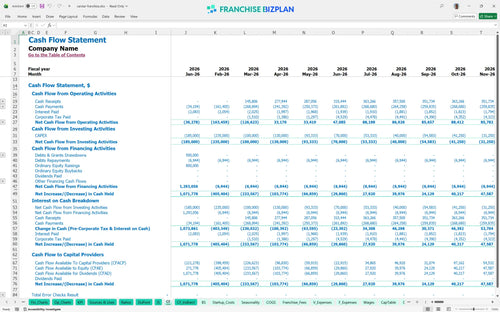
The lowest cash point occurs in June 2026 at $232,000. This is a tight window, so maintaining a cash buffer is defintely necessary to handle the lag between completing repairs and receiving insurance payouts. Use this franchise unit overhead and operating expense spreadsheet to track your monthly burn closely.
Switching between Low, Medium, and High scenarios shows how a 10% drop in collision volume can delay payback by a full year. The High case assumes faster adoption of luxury repair certifications, which significantly boosts Year 1 margins and shortens the path to the $2.7M Year 5 EBITDA target. Scenarios prepare you for the reality that never goes exactly to plan.
Finance: update unit break-even and payback model by Friday
This franchise unit financial model is fully customizable in Excel, featuring pre-filled formulas and editable assumptions for your specific territory. You can adjust local labor rates, rent, and repair volumes to see how different operating scenarios impact your bottom line. Customization is the difference between a generic guess and a bank-ready plan using this Excel template for auto body shop financial planning.

Map out your long-term growth with detailed 5-year automotive franchise financial projections for revenue, costs, and cash flow. The model scales from a single shop to a multi-unit operation, helping you visualize the transition from initial ramp-up to a mature, high-volume collision center. Long-term visibility prevents short-term panic when performing financial forecasting for automotive service centers or a financial model for multi-unit franchise expansion.

Operating under a major brand requires precise tracking of a 5.5% royalty and a 1% marketing fund contribution. This profit and loss statement template bakes these costs directly into your monthly projections so you see the exact cash remaining after the franchisor takes their cut. Royalties are a top-line tax; you have to model them accurately to protect your bottom line.

Launching a collision center is capital intensive, requiring significant investment in paint booths and frame machines. Our franchise startup cost calculator identifies the exact sales volume needed to cover your fixed costs, ensuring you know your 'survival number' from day one. Knowing your break-even analysis is the first step to sleeping through the night when learning how to calculate startup costs for a collision repair franchise.

We include built-in franchise unit operational expenses and industry benchmarks for labor and occupancy to help you sanity-check your projections. If your technician costs or rent percentages drift too far from industry norms, the model highlights the variance so you can adjust your strategy. Benchmarks keep your ego in check and your expenses in line through best practices for franchise unit budget management.


Simply purchase and download the financial model template, then access it instantly using Microsoft Excel or Google Sheets. No installation or technical expertise required-just open and start working.

Enter your business-specific numbers, including revenue projections, costs, and investment details. The pre-built formulas will automatically calculate financial insights, saving you time and effort.

Leverage the investor-ready format to confidently showcase your financial projections to banks, franchise representatives, or investors. Impress stakeholders with clear, data-driven insights and professional reports.

Leverage the investor-ready format to confidently present your projections to banks, franchise representatives, or investors.