
All-in-one Dashboard
Core inputs and core outputs


This franchise unit financial model provides a complete Excel-based toolkit for projecting 5-year performance, including detailed startup costs, labor planning, and unit-level profitability.
Core inputs and core outputs
Three scenario analysis
Presentation ready
DuPont analysis
Researched revenue assumptions
Lender-friendly financial outputs
Revenue stream detailed view
Performance metrics benchmark
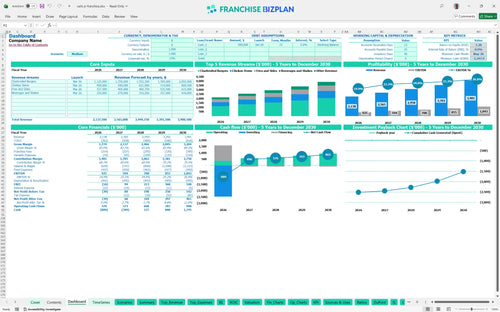
We built this franchise financial model using detailed research to support your fast food franchise business plan. Key assumptions for this franchise unit, such as the $2,138,000 year-one revenue and $425,000 EBITDA, are pre-populated and fully editable to reflect your specific location. Data beats intuition every single time.
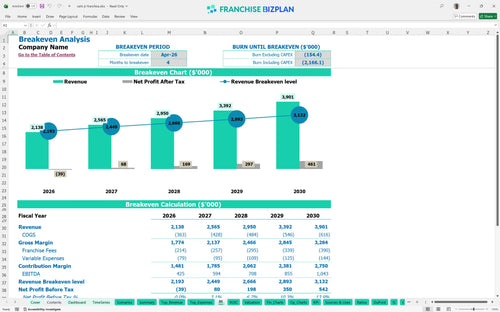
The model shows this franchise unit reaches its monthly break-even date by April 2026, just four months after launching. To hit this, you defintely need to manage the 15% food ingredient cost and high labor spend for your 15+ person crew. Profit is a choice made during site selection and daily execution.
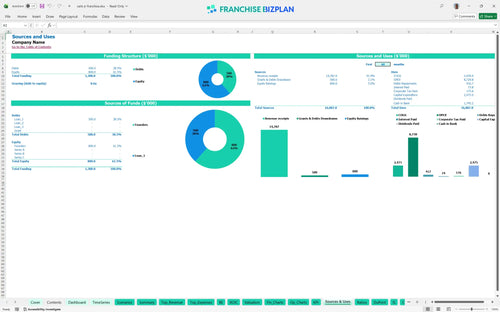
Your restaurant franchise startup costs total approximately $2,475,000, covering everything from the $25,000 franchise fee to the $400,000 drive-thru infrastructure. This capital expenditure budget is heavily weighted toward leasehold improvements and specialized charbroiling gear. Cash is the oxygen of your kitchen.
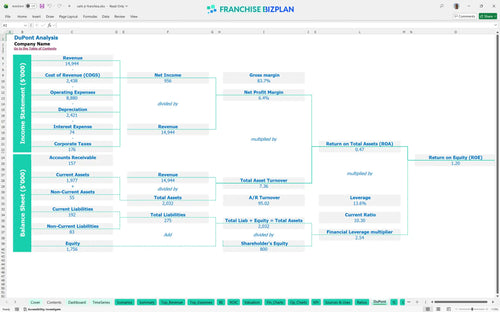
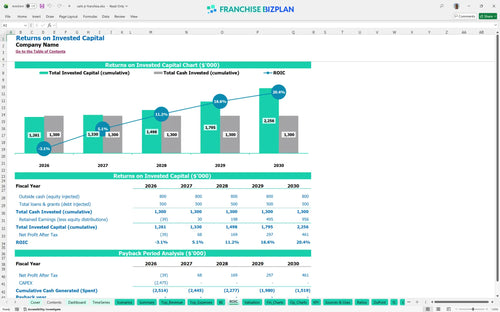
The restaurant franchise investment return analysis indicates a payback period occurring after year five, which is common for high-CAPEX models. With an IRR of 0.93% and a Return on Equity of 1.2, the focus is on long-term equity building rather than immediate cash extraction. Time is the most expensive ingredient in your model.
To reach the break-even point by month four, the unit must generate enough volume to cover a $25,000 monthly rent and a 10% combined royalty and marketing burden. The primary lever here is throughput in the dual-lane drive-thru, which handles a massive portion of the projected revenue. Speed in the drive-thru is speed to profit.
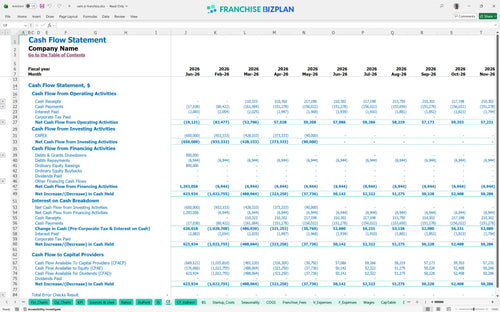
The projected cash flow for new franchise location shows a tight runway, with the lowest cash point hitting negative $1,248,000 in May 2026. You must secure enough financing to cover this peak deficit before the unit stabilizes and begins generating positive EBITDA. Running out of cash is the only way to lose this game.
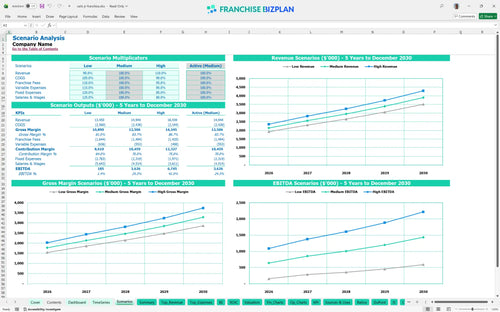
Comparing scenarios is vital for any franchise unit profitability analysis; a 10% drop in revenue can delay your break-even by several months. The high scenario assumes better local marketing execution and higher average tickets, which pushes year-5 EBITDA toward the $1,043,000 mark. Hope is not a strategy, but scenario planning is.
Finance: update unit break-even and payback model by Friday
This Excel template for restaurant franchise financial planning is built for flexibility, allowing you to swap out every variable from burger prices to local utility rates. The pre-filled formulas handle the heavy lifting, so you can focus on testing different labor models or rent scenarios without breaking the math. Every 1-point margin leak matters fast in a single-unit model.

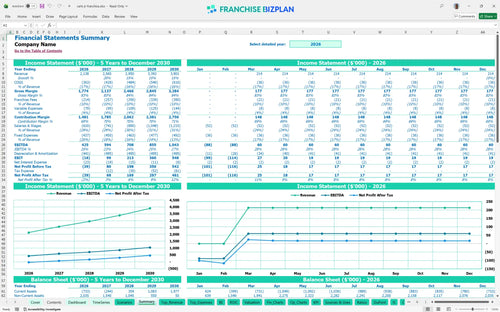
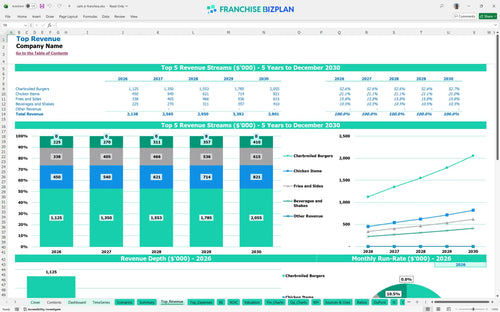
Map out your long-term growth with quick service restaurant financial projections that span sixty months of operation. The model tracks the climb from a $2,138,000 year-one revenue to a mature $3,901,000 by year five, giving you a clear view of how scale impacts your bottom line. Long-term planning beats short-term guessing every time.

This tool simplifies the franchise royalty fee structure by automatically calculating the 4% royalty and 6% marketing fund contributions against your monthly sales. It ensures you account for these off-the-top costs before you ever look at store-level profit, so there are no surprises during your first audit. Royalties come off the top, no matter what happens.

Learn how to calculate startup costs for a fast food franchise by totaling your $1,000,000 leasehold improvements and $400,000 drive-thru infrastructure. The model identifies the exact sales volume needed to cover your $25,000 monthly rent and variable costs, identifying your survival line from day one. Knowing your zero-profit number is the key to survival.

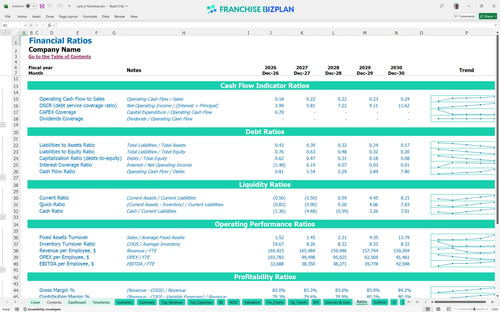
Use this franchise unit performance tracking spreadsheet to compare your projected 15% food ingredient cost against standard industry ranges. It helps you sanity-check your assumptions for staffing and utilities, ensuring your plan stays grounded in the reality of high-volume fast food operations. Benchmarks keep your ego and your budget in check.


Simply purchase and download the financial model template, then access it instantly using Microsoft Excel or Google Sheets. No installation or technical expertise required-just open and start working.

Enter your business-specific numbers, including revenue projections, costs, and investment details. The pre-built formulas will automatically calculate financial insights, saving you time and effort.

Leverage the investor-ready format to confidently showcase your financial projections to banks, franchise representatives, or investors. Impress stakeholders with clear, data-driven insights and professional reports.

Leverage the investor-ready format to confidently present your projections to banks, franchise representatives, or investors.