
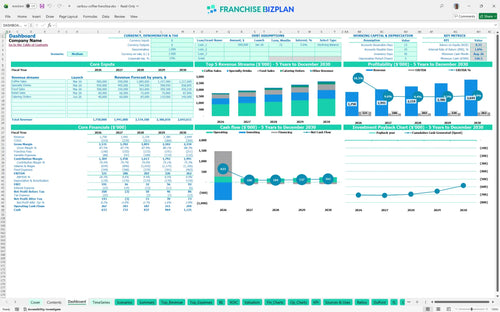
All-in-one Dashboard
Core inputs and core outputs


This financial model for an upscale urban coffee shop provides a complete pro forma suite to evaluate cash flow, ROI, and daily operational viability.
Core inputs and core outputs
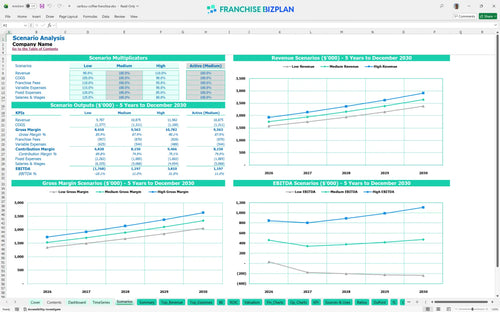
Three scenario analysis
Presentation ready
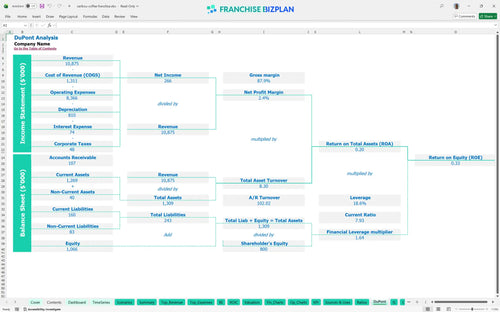
DuPont analysis
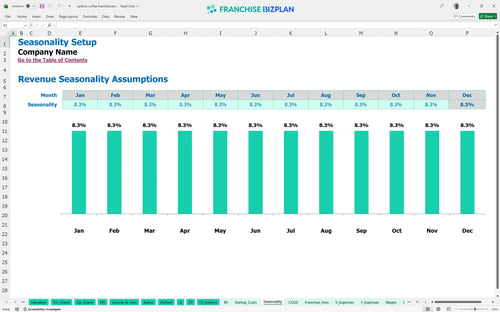
Researched revenue assumptions
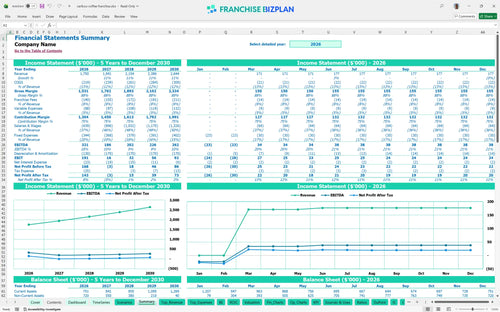
Lender-friendly financial outputs
Revenue stream detailed view
Performance metrics benchmark
We built this coffee shop franchise unit financial planning guide based on detailed market research into premium beverage operations. All key assumptions, including the $1.75 million initial revenue target and the $850,000 total CAPEX (Capital Expenditure) requirement, are pre-populated and fully adjustable to fit your specific Denver or urban market site.
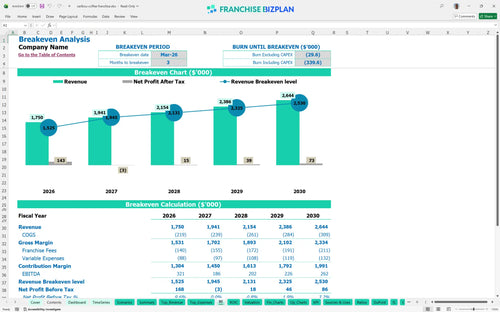
The unit reaches operational break-even quickly in March 2026, but the EBITDA trajectory shows a dip from $321,000 in year one to $186,000 in year two as you scale from 12 to 14 full-time baristas. Speed to break-even is great, but long-term margin is the real battle.
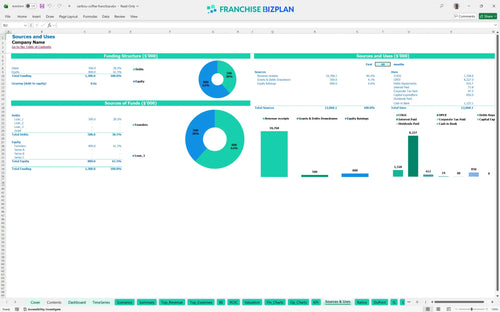
You need $850,000 to launch this unit, covering the $30,000 franchise fee and significant physical infrastructure like $90,000 for outdoor fire pits. You are essentially building a $850,000 asset before the first bean is ground.
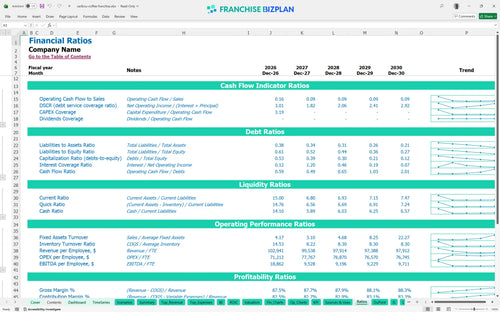
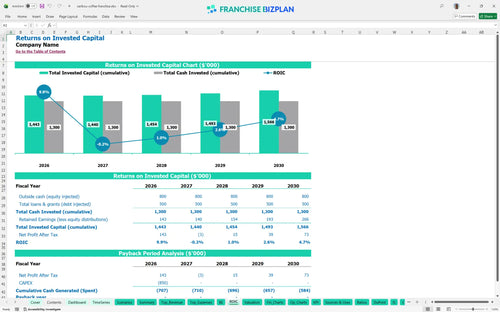
The coffee franchise ROI and profitability analysis shows an IRR of 0.99% and a return on equity of 0.33, with a payback period occurring after year five. This is a marathon, not a sprint, given the 5-year plus payback.
The unit hits break-even in month 3, which is March 2026, provided you can cover the $20,000 monthly premium district rent. Fixed costs are a heavy lift at $20,000 a month for rent alone.
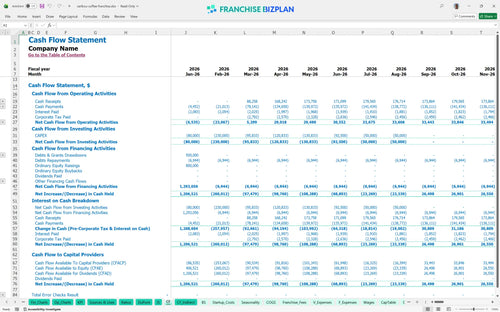
The lowest cash point is $526,000 in August 2026, meaning you need a solid liquidity buffer to survive the initial ramp-up and equipment payments. Liquidity is your best friend when fire pits cost ninety grand.
A High scenario focused on catering can push revenue toward the $2.64 million year-five mark faster, while a Low scenario makes the $20,000 rent defintely harder to swallow. Execution in the high-income Cherry Creek area determines if you hit the High case.
Finance: update unit break-even and payback model by Friday.
This coffee shop franchise financial model is a professional-grade Excel tool designed for deep-dive unit economics. It features fully editable assumptions and pre-filled formulas, allowing you to adjust everything from the $20,000 monthly premium rent to specific barista staffing levels as your coffee franchise startup costs evolve.

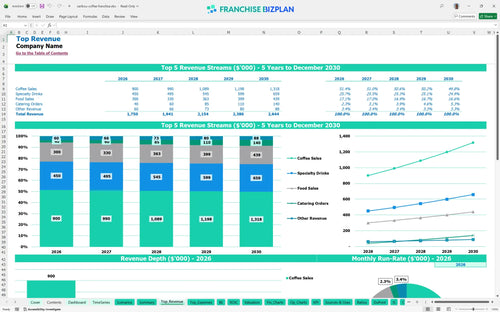
Plan for long-term growth with detailed retail franchise financial projections that span 60 months of operation. The model tracks the climb from $1.75 million in year-one revenue to $2.64 million by year five, helping you visualize how store-level EBITDA scales as you optimize your specialty drink and food sales mix.

Managing the 'off-the-top' costs is critical for any franchise unit profit and loss template. This model specifically calculates the 5% royalty fee and 3% marketing fund contribution against your projected sales, ensuring you understand exactly how much cash remains to cover your $75,000 manager salary and other local overhead.

Before you open, you need to know how to calculate startup costs for a coffee franchise accurately. This tool aggregates your $30,000 franchise fee, $400,000 in leasehold improvements, and $120,000 for espresso equipment to determine your total startup capital requirements and the exact month you will stop burning cash.

Use built-in retail site selection metrics and industry standards to validate your coffee shop franchise financial spreadsheet template. By comparing your 10% coffee ingredient COGS (Cost of Goods Sold) and 2% payment fees against typical franchise profitability analysis benchmarks, you can identify margin leaks before they impact your bank balance.


Simply purchase and download the financial model template, then access it instantly using Microsoft Excel or Google Sheets. No installation or technical expertise required-just open and start working.

Enter your business-specific numbers, including revenue projections, costs, and investment details. The pre-built formulas will automatically calculate financial insights, saving you time and effort.

Leverage the investor-ready format to confidently showcase your financial projections to banks, franchise representatives, or investors. Impress stakeholders with clear, data-driven insights and professional reports.

Leverage the investor-ready format to confidently present your projections to banks, franchise representatives, or investors.