
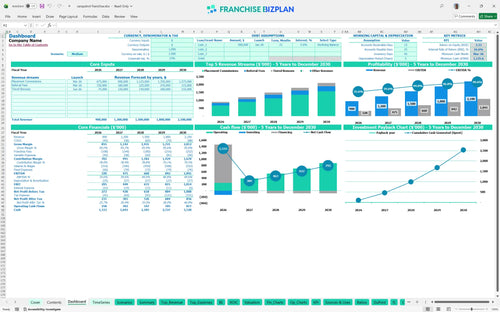
All-in-one Dashboard
Core inputs and core outputs


This financial model provides a comprehensive Excel-based framework to forecast revenue, expenses, and cash flow for a new senior placement territory.
Core inputs and core outputs
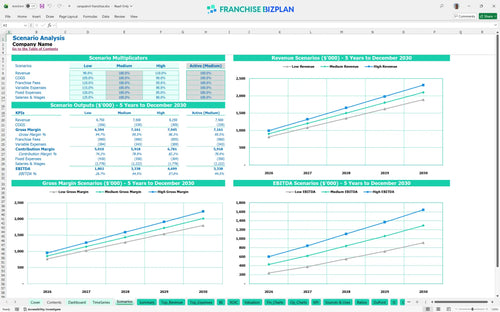
Three scenario analysis
Presentation ready
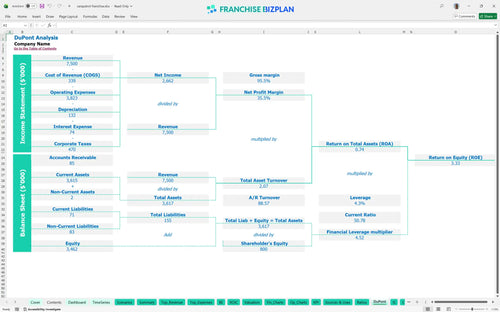
DuPont analysis
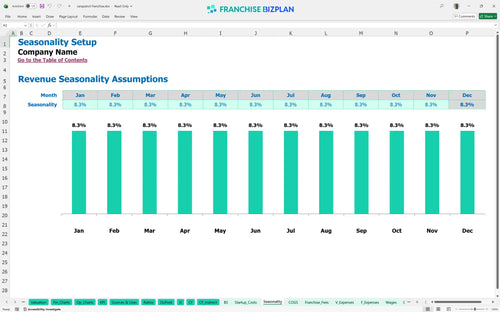
Researched revenue assumptions
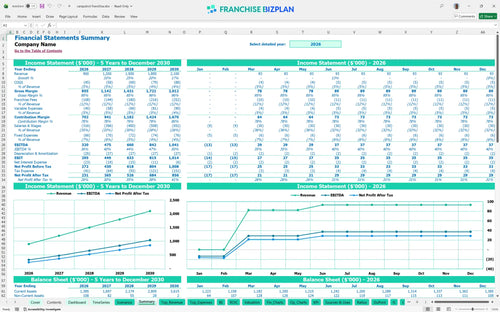
Lender-friendly financial outputs
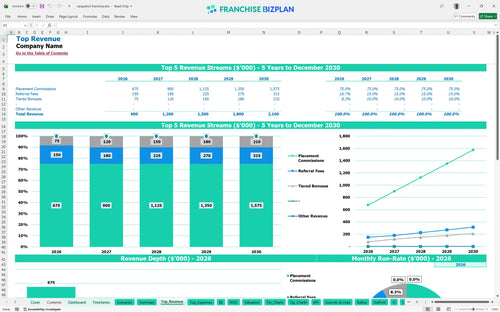
Revenue stream detailed view
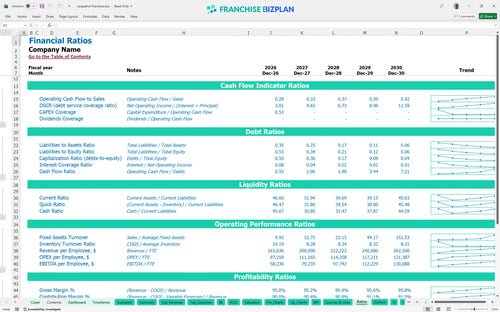
Performance metrics benchmark
We built this franchise unit financial model using our own research to provide a realistic look at the senior placement sector. Key assumptions, including the $57,000 initial fee and a Year 1 EBITDA of $320,000, are pre-populated and fully editable to match your specific territory. This is a data-driven look at unit-level performance.
The unit hits the ground running with a $320,000 EBITDA in the first year, scaling significantly as referral networks mature. You will defintely see net profit margins improve as travel and tour expenses drop from 3.5% to 2.7% over five years. Profitability hits fast if you manage the advisor pipeline.
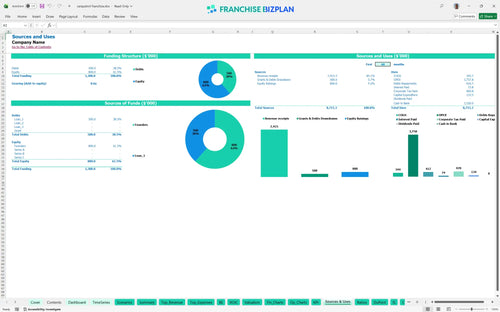
You need approximately $133,500 in upfront capital to cover the franchise fee, office setup, and the company vehicle. This doesn't include your working capital buffer, which is critical since the model shows a minimum cash requirement of $1.136 million during the ramp-up phase. Your biggest check goes to the brand and the wheels.
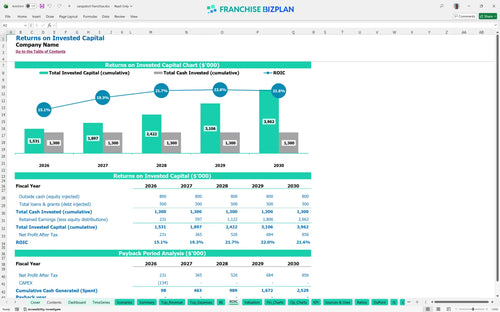
Investors can expect an Internal Rate of Return (IRR) of 16.58% and a Return on Equity (ROE) of 3.33. While the unit is highly profitable from year one, the total payback of the initial investment occurs after the five-year mark due to the heavy initial cash requirements. Patience is required as the full payback extends past the five-year mark.
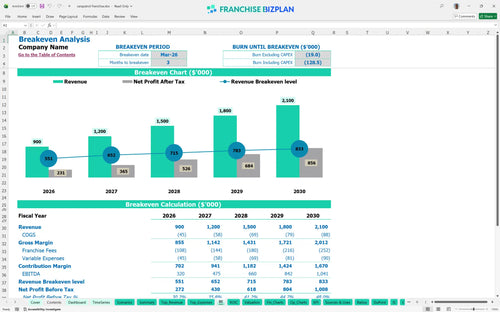
The unit reaches break-even in March 2026, just three months after the initial launch. This quick turnaround is driven by the low overhead of the advisory model and the high average commission per placement. Three months to break-even is a sprint, not a marathon.
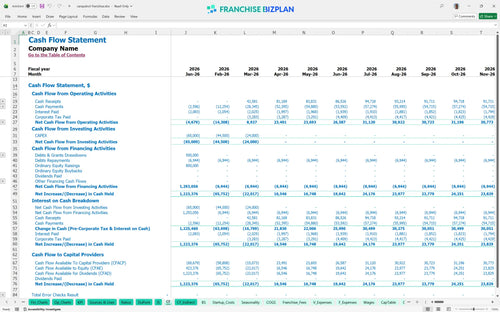
The lowest cash point occurs in March 2026, coinciding with your break-even month, where you need at least $1.136 million on hand to maintain operations safely. This suggests you need a significant liquidity cushion to handle the timing gap between placements and commission payouts. Cash is your oxygen during the first quarter of operations.
In a high-growth scenario, reaching $2.1 million in revenue by year five pushes EBITDA past the $1 million mark annually. Conversely, if placement volume lags, the 12% combined royalty and marketing fee can squeeze margins if your fixed costs like the $3,500 monthly rent aren't covered. High-performance scenarios turn a solid business into a local powerhouse.
Finance: update unit break-even and payback model by Friday
This franchise unit financial model is a flexible Excel tool designed for high-stakes decision making. You can adjust every assumption from placement commission rates to local advisor salaries, and the pre-filled formulas instantly update your projections. Every cell is open for your specific market tweaks.

Planning for a senior placement business requires a long-term view of local referral networks and facility relationships. This model provides a detailed 5-year roadmap, showing revenue scaling from $900,000 in year one to $2.1 million by year five. Five years of data lets you see the exit before you enter.

Operating within a system means accounting for top-line deductions that impact your take-home pay. The model tracks the 11% royalty and 1% marketing fund contributions against your gross commissions so you can see the true store-level margin. Royalty fees are a top-line tax that never sleeps.

Launching a service-based unit involves more than just the initial fee; you have to account for office improvements, vehicles, and initial training. This tool maps out your total investment and identifies the exact month your placement volume covers your $5,650 in monthly fixed costs. Knowing your number keeps the lights on during the ramp.

We include researched benchmarks for senior care advisory services to help you validate your projections against real-world performance. You can compare your travel expenses, which start at 3.5% of revenue, and your advisor payroll against industry standards to ensure your model is realistic. Don't guess when you can use proven operational guardrails.


Simply purchase and download the financial model template, then access it instantly using Microsoft Excel or Google Sheets. No installation or technical expertise required-just open and start working.

Enter your business-specific numbers, including revenue projections, costs, and investment details. The pre-built formulas will automatically calculate financial insights, saving you time and effort.

Leverage the investor-ready format to confidently showcase your financial projections to banks, franchise representatives, or investors. Impress stakeholders with clear, data-driven insights and professional reports.

Leverage the investor-ready format to confidently present your projections to banks, franchise representatives, or investors.