


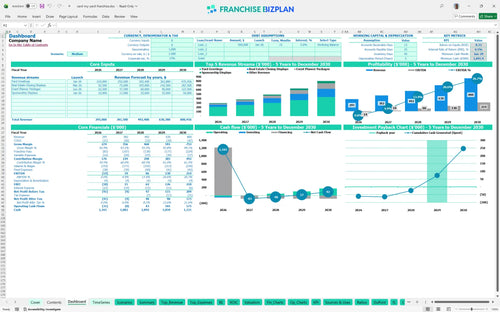
All-in-one Dashboard
Core inputs and core outputs



This Excel template for franchise unit financial planning includes everything from startup budgets to 5-year P&L statements for a yard greeting territory.
Core inputs and core outputs
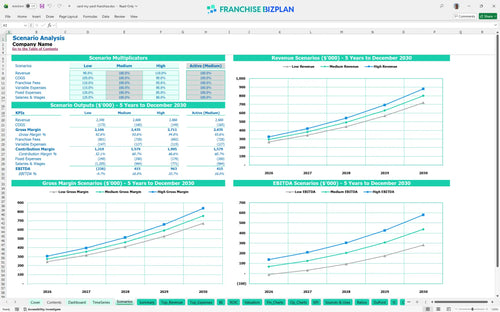
Three scenario analysis
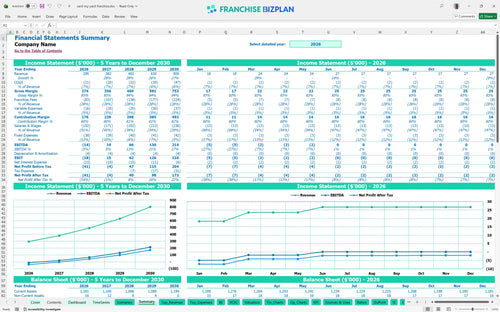
Presentation ready
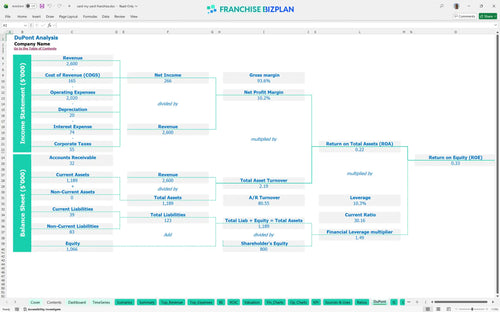
DuPont analysis
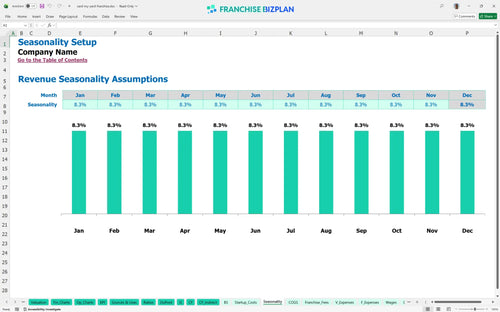
Researched revenue assumptions
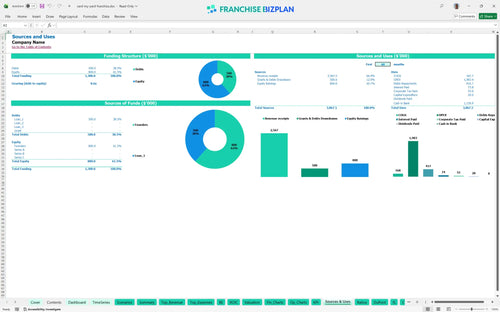
Lender-friendly financial outputs
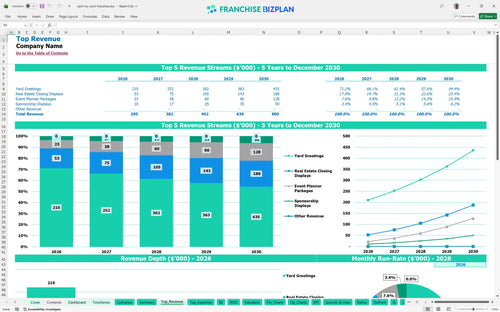
Revenue stream detailed view
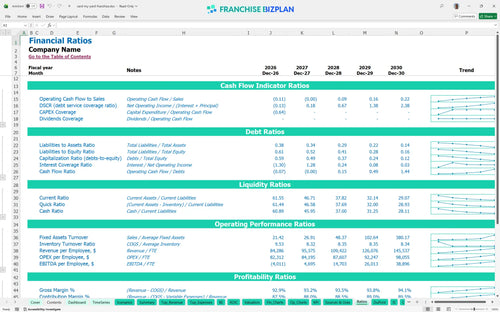
Performance metrics benchmark
We built this financial modeling for yard greeting businesses using our own research into the unit economics of a service territory. Key assumptions like revenue streams, the $52,000 operations manager salary, and the 25% royalty fee are pre-populated with researched data and are fully editable. This model helps you visualize how a $295,000 Year 1 revenue scales into a mature $800,000 operation.
This franchise unit reaches profitability in Year 2 with a projected $19,000 EBITDA (earnings before interest, taxes, depreciation, and amortization). While Year 1 shows a small $14,000 loss due to ramp-up costs, the model forecasts steady growth to $214,000 in annual profit by Year 5 as revenue scales. Profit is a Year 2 story here.
Launching this territory requires a total initial investment of approximately $20,000 based on our capital expenditure planning. This covers the $8,000 franchise fee, a $5,000 used delivery van, and $3,500 for your initial signage inventory and marketing starter kit. You can start this for the price of a used sedan.
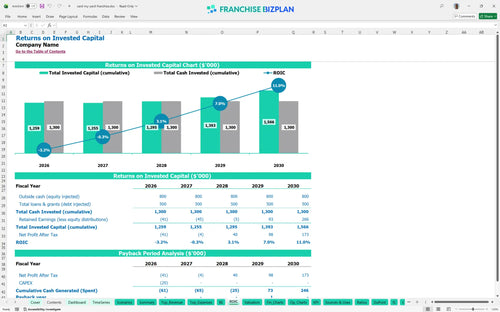
Franchisees can expect a 4.48% IRR (internal rate of return) and a payback period of 4 years. With an ROE (return on equity) of 0.33 and Year 5 EBITDA hitting $214,000, the model demonstrates how local density drives long-term value. Four years is a standard climb for this kind of equity.
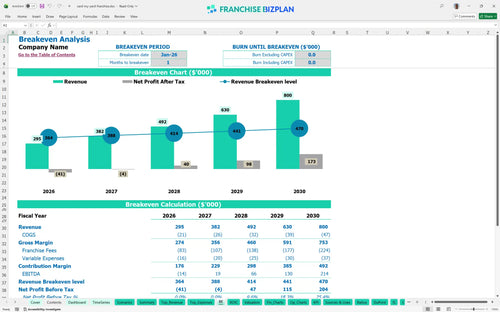
The monthly break-even point occurs in January 2026, just one month after launch. Still, your ability to cover fixed costs like the $1,200 storage hub rent depends heavily on maintaining volume against the 25% royalty burden. Volume is the only way to outrun a 25% royalty.
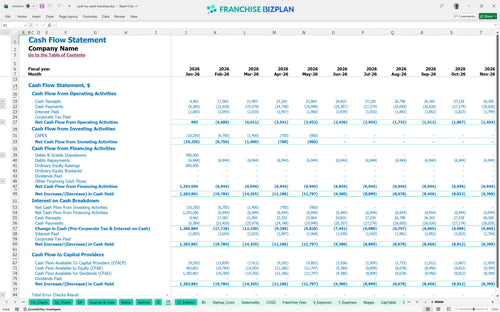
Your lowest cash point is projected for January 2029 at $1,042, which leaves almost no room for error. We defintely suggest maintaining a cash buffer to manage the timing gaps between payroll and seasonal revenue peaks. Watch that 2029 cash dip like a hawk.
Switching to a High scenario improves the Year 1 margin and accelerates the 4-year payback. If revenue exceeds the $295,000 Year 1 target, you absorb the fixed salaries for the Operations Manager and Sales Coordinator much more efficiently. The High case turns a job into a real asset.
This franchise unit financial model is fully customizable in Excel, featuring pre-filled formulas and editable assumptions. You can easily adjust variables for your specific territory, whether you are looking at North Scottsdale or another high-density market. Every 1-point margin leak matters fast in a single-unit model. This franchise business plan Excel tool lets you tweak pricing and volume to see the impact on your bottom line immediately.

Map out your growth with detailed 5-year revenue, cost, and cash flow projections. This tool helps you visualize the transition from a single-territory startup to a mature service operation with $800,000 in annual sales. Growth is a five-year game, and these franchise unit financial projections provide the roadmap you need to stay on track. Use the franchise unit cash flow projection spreadsheet to manage your month-to-month liquidity during the ramp-up phase.

The model tracks specific financial obligations like the 25% royalty and 3% marketing fund. Understanding these 'off-the-top' costs is vital for calculating your true store-level margin and net profitability. Royalties are your biggest fixed hurdle in this service model. By using this tool to learn how to create a P&L statement for a franchise, you can see exactly how much cash stays in your pocket after franchise royalty fees are paid.

Use the franchise startup cost calculator to estimate your total initial investment, including the $8,000 franchise fee and equipment needs. It identifies the exact sales level required to cover your fixed storage and labor costs. Know your number before you sign the agreement. This break-even point calculation helps you understand how many yard greetings you need to sell each week to keep the lights on.

We include industry benchmarks for labor and gross margins to help you sanity-check your plan. Comparing your 5.8% signage material cost against typical yard greeting standards ensures your projections remain grounded in reality. Benchmarks keep your ego in check while you build your franchise profitability analysis. The operating expenses spreadsheet comes pre-loaded with typical costs for storage, utilities, and insurance to simplify your planning.


Simply purchase and download the financial model template, then access it instantly using Microsoft Excel or Google Sheets. No installation or technical expertise required-just open and start working.

Enter your business-specific numbers, including revenue projections, costs, and investment details. The pre-built formulas will automatically calculate financial insights, saving you time and effort.

Leverage the investor-ready format to confidently showcase your financial projections to banks, franchise representatives, or investors. Impress stakeholders with clear, data-driven insights and professional reports.

Leverage the investor-ready format to confidently present your projections to banks, franchise representatives, or investors.