
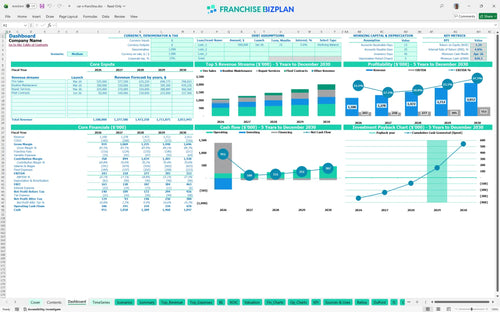
All-in-one Dashboard
Core inputs and core outputs


This franchise unit financial model template provides a complete Excel-based toolkit for forecasting revenue, managing startup expenses, and analyzing five-year profitability for a new automotive service center.
Core inputs and core outputs
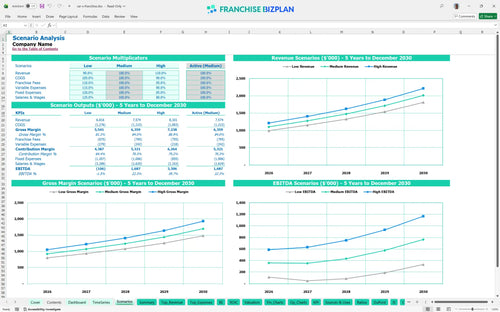
Three scenario analysis
Presentation ready
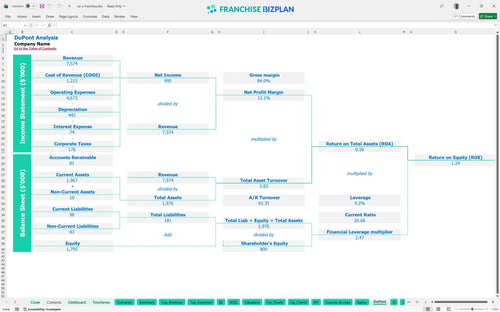
DuPont analysis
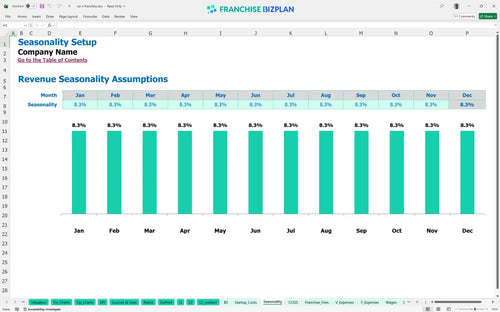
Researched revenue assumptions
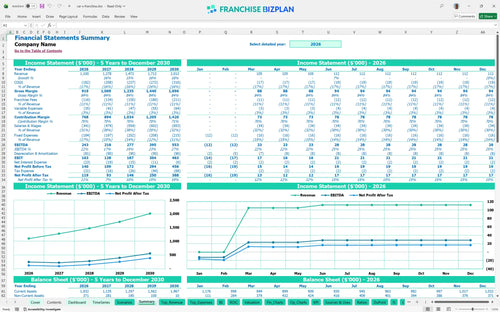
Lender-friendly financial outputs
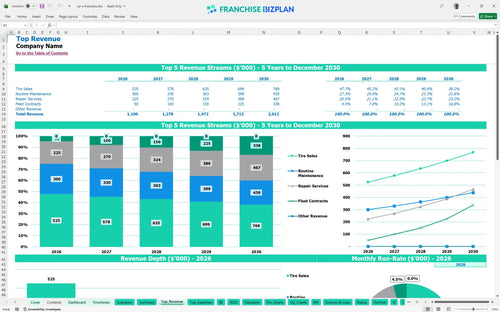
Revenue stream detailed view
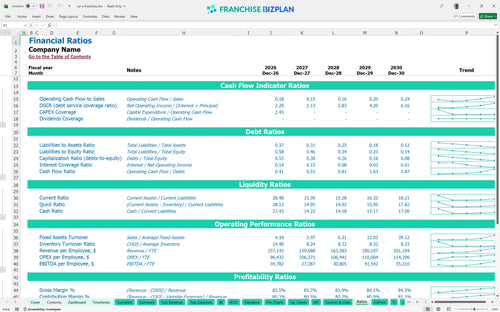
Performance metrics benchmark
We built this franchise unit financial model using our own research to ensure it reflects the day-to-day realities of the automotive service industry. Key assumptions like revenue streams, staffing, and capital investments are pre-populated with researched data specific to this automotive repair franchise and are fully editable. With Year 1 revenue projected at $1,100,000 and an initial EBITDA of $243,000, this tool helps you validate the unit economics before signing the agreement.
The auto service center profitability analysis shows the unit becomes profitable in its first year, generating $243,000 in EBITDA. Determining profitability for a car maintenance franchise requires looking past the $1.1M top line to account for the 10.5% combined royalty and marketing fees plus the $10,000 monthly rent. By year five, net profit scales significantly as revenue hits $2,012,000 and parts margins improve.
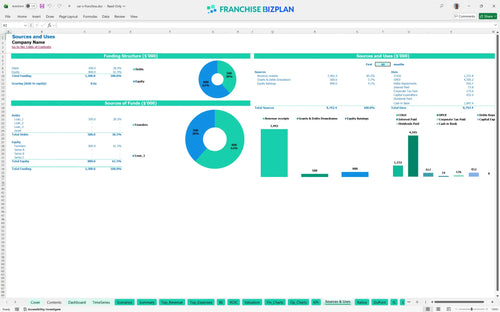
To understand how to calculate startup costs for an auto repair franchise, you must look at the $452,000 required for core assets and pre-opening. The franchise investment cost breakdown includes $150,000 for leasehold improvements and $100,000 for automotive lifts. The model also accounts for a significant cash buffer, as the lowest cash point is $820,000 during the initial ramp-up phase.
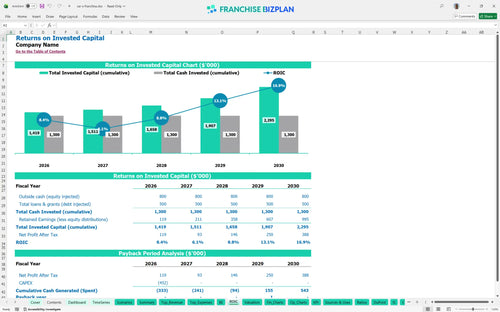
Analyzing return on investment for auto repair franchise units shows an Internal Rate of Return (IRR) of 4.03% and a Return on Equity (ROE) of 1.24. The franchise unit economic model for service centers estimates a 4-year payback period, which is consistent with the heavy upfront equipment investment. This provides a clear picture for your financial due diligence checklist for prospective franchisees.
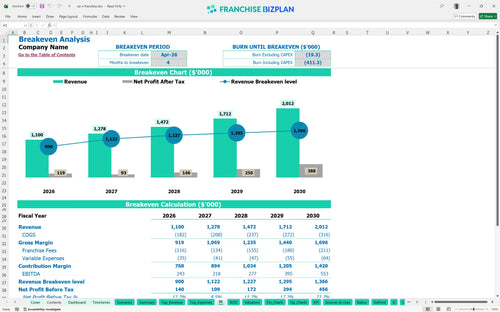
Financial planning for new automotive service franchise units reveals a break-even date of April 2026, just four months after launching. The key driver for reaching this point is the $550,000 combined annual revenue from tire sales and routine maintenance. Because fixed costs like the $75,000 GM salary and $120,000 annual rent are static, increasing the average ticket is the fastest way to cover overhead.
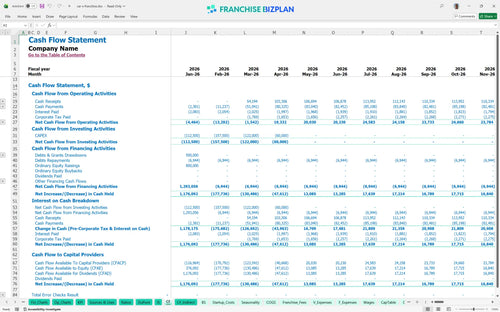
Using this Excel template for franchise unit cash flow forecasting, we identify the lowest cash point at $820,000 in April 2026. You defintely need to maintain a strict schedule for the $452,000 in CAPEX to avoid dipping below your minimum cash requirements. Still, the quick four-month path to break-even suggests that the primary risk is a delay in the shop's opening date rather than long-term demand.
Automotive franchise revenue stream forecasting allows you to compare how a 10% change in traffic impacts your 4.03% IRR. The High scenario, driven by superior local marketing execution, shows EBITDA jumping from $243,000 to $553,000 over five years as fleet contracts mature. The Low scenario highlights how the 10.5% royalty and marketing burden can pressure margins if average ticket prices fall below expectations.
Finance: update unit break-even and payback model by Friday.
This auto repair franchise financial model is built entirely in Excel, giving you total control over every variable. You can easily adjust pre-filled formulas and editable assumptions to match your specific territory, local labor rates, and real estate costs. It is designed to be a flexible tool for a franchise unit financial projection template that adapts as your site selection and build-out plans evolve.

Plan for the long haul with an automotive repair shop P&L statement that covers five full years of operations. The model tracks how revenue grows from $1.1 million in the first year to over $2 million by year five, helping you visualize the transition from a new shop to a mature service center. It provides a clear view of cash flow and balance sheet health to ensure your small franchise chain stays solvent during growth.

Managing the financial obligations to the franchisor is simple with our built-in franchise royalty fee calculation. The model automatically applies the 5% royalty and 5.5% marketing fund contribution against your monthly gross sales, so you see the net impact on your bottom line. This template for calculating franchise royalty and marketing fees ensures you never overlook the ongoing costs of brand participation.

This automotive franchise startup costs excel tool breaks down the total initial investment, from the $25,000 franchise fee to the $150,000 leasehold improvements. By integrating these with your monthly operating costs, the model performs a break-even analysis for franchises to show exactly what sales volume you need each month. It is a vital part of any franchise business plan financial model for securing financing or partner approval.

Our model includes researched auto center operational expenses to help you sanity-check your numbers against industry standards. We have pre-loaded data for estimating operational expenses for auto repair businesses, including parts costs starting at 14% and shop supplies at 2.5%. These benchmarks allow you to see if your projected labor or rent costs are out of line with typical high-performing units.


Simply purchase and download the financial model template, then access it instantly using Microsoft Excel or Google Sheets. No installation or technical expertise required-just open and start working.

Enter your business-specific numbers, including revenue projections, costs, and investment details. The pre-built formulas will automatically calculate financial insights, saving you time and effort.

Leverage the investor-ready format to confidently showcase your financial projections to banks, franchise representatives, or investors. Impress stakeholders with clear, data-driven insights and professional reports.

Leverage the investor-ready format to confidently present your projections to banks, franchise representatives, or investors.