


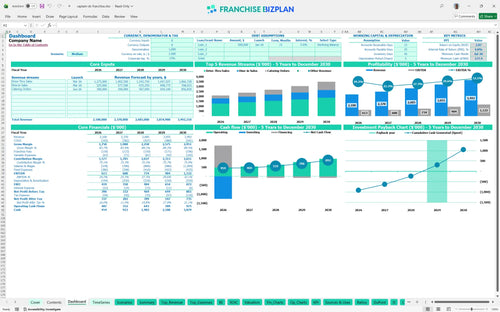
All-in-one Dashboard
Core inputs and core outputs



This Excel template for restaurant franchise financial forecasting includes automated financial statements, CAPEX schedules, and detailed payroll calculators designed specifically for high-volume seafood units.
Core inputs and core outputs
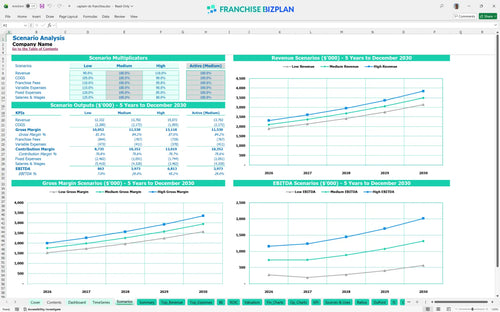
Three scenario analysis
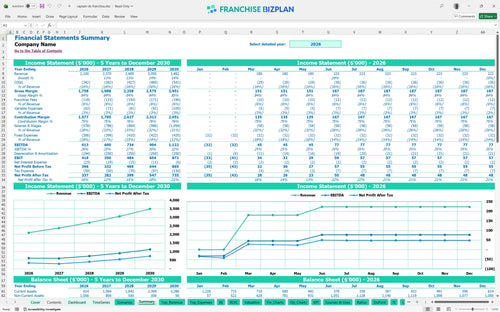
Presentation ready
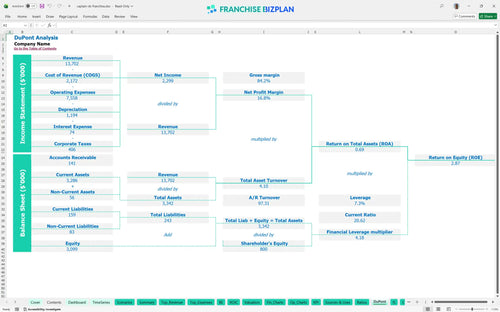
DuPont analysis
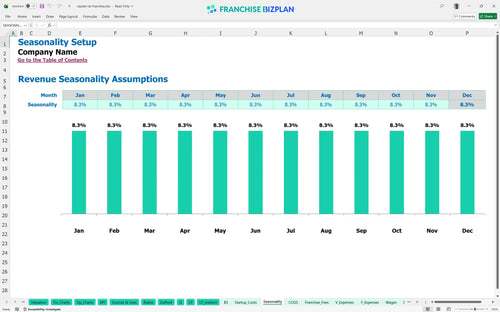
Researched revenue assumptions
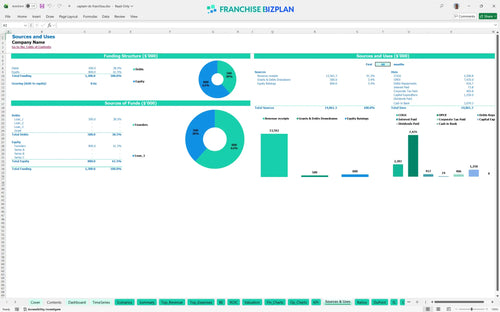
Lender-friendly financial outputs
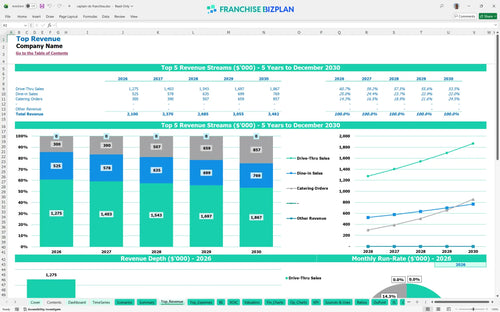
Revenue stream detailed view
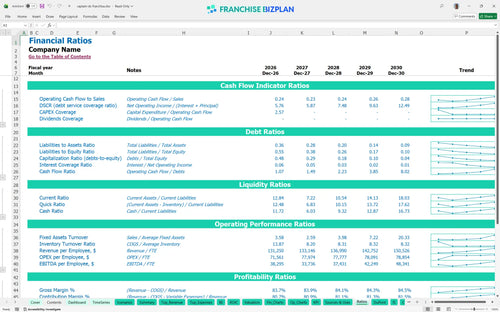
Performance metrics benchmark
We developed this restaurant franchise business plan model using detailed research on fast-casual seafood operations. The assumptions for drive-thru, dine-in, and catering revenue streams are pre-populated with data showing a $2.1M year-one target and are fully editable to match your specific location. You can easily adjust the $1.25M in startup capital and the 4.5% royalty fees to see how they impact your bottom line.
The unit reaches profitability defintely within the first year, generating $613,000 in EBITDA during year one. As food costs scale down from 14.5% to 13.7% and revenue grows to $3.49M by year five, the store-level margin significantly expands. Profitability depends on maintaining high-volume drive-thru traffic and managing the $22,000 monthly rent burden.
To launch this seafood unit, you need a total initial investment of approximately $1,250,000. This capital expenditure planning covers the $35,000 franchise fee, $450,000 for leasehold improvements, and $280,000 for specialized kitchen equipment like fryers and grills. You should also maintain the $177,000 cash buffer identified as the minimum liquidity point during the ramp-up phase.
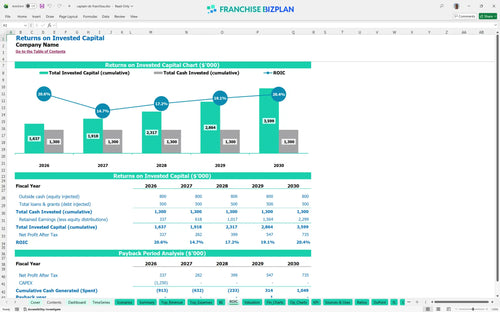
Investors can expect a 3.95% Internal Rate of Return (IRR) and a Return on Equity (ROE) of 2.87. Based on the projected cash flows, the franchise investment ROI results in a 4-year payback period. While the initial years focus on debt service and recovery, the year-five EBITDA of $1.12M represents a strong mature-unit performance.
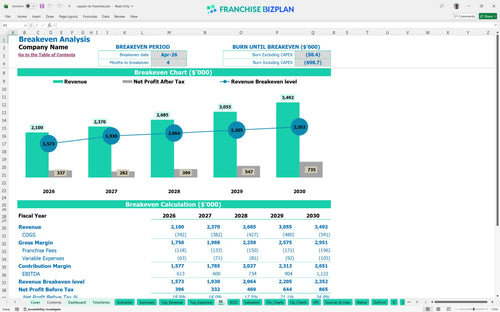
The franchise unit break-even analysis spreadsheet shows the store hits the break-even date in April 2026, just four months after launch. This quick turnaround is driven by the $850,000 in projected first-year drive-thru sales. To hit this point, you must maintain an average ticket that covers the 5.6% combined royalty and marketing fee burden.
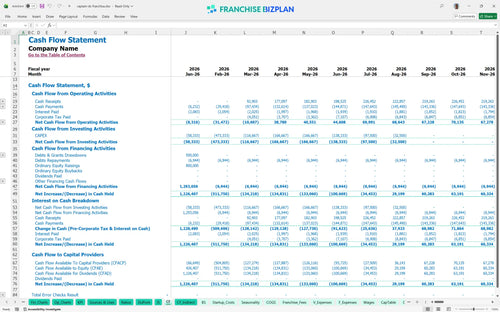
Analyzing franchise unit operating cash flow reveals the lowest cash point occurs in July 2026 at $177,000. You need enough working capital to bridge the gap between the $1.25M build-out and the point where monthly EBITDA covers all fixed costs. We recommend a 6-month runway to handle any delays in the coastal design construction phase.
Evaluating franchise unit performance metrics across scenarios shows that a 10% drop in revenue significantly extends the payback period beyond 4 years. In the high-growth scenario, where catering orders exceed $571,000 by year five, the year-one EBITDA margin stays healthy despite the $31,000 monthly utility and insurance costs. Scenario planning is vital for managing the $1.25M startup budget template for retail food franchise operations.
This franchise financial model template provides a flexible Excel environment where you can adjust every variable of your seafood restaurant. It features pre-filled formulas and editable assumptions for revenue, labor, and overhead, making it simple to adapt the projections to your specific territory or local market conditions.

Planning for long-term growth requires more than just a first-year estimate, so we built a detailed 5-year outlook. This fast casual restaurant financial projections tool tracks revenue scaling from $2.1M in year one to over $3.4M by year five, giving you a clear view of your long-term store-level EBITDA and cash flow trends.

Understanding your real margin means accounting for every dollar sent to the franchisor. This model includes a precise franchise royalty fee calculation based on a 4.5% royalty and 1.1% marketing fund, ensuring you see the impact of these obligations on your monthly operating cash flow before you sign a lease.

Launching a new site involves significant upfront costs, from leasehold improvements to specialized kitchen gear. Our franchise startup cost calculator helps you map out the $1.25M initial investment and determine the exact sales volume needed to cover your $22,000 monthly rent and variable costs.

We integrated seafood industry standards to help you with food and labor cost optimization. By comparing your projected 14.5% food cost against typical benchmarks, you can identify margin leaks early and adjust your restaurant operational expenses to stay competitive in the fast-casual space.


Simply purchase and download the financial model template, then access it instantly using Microsoft Excel or Google Sheets. No installation or technical expertise required-just open and start working.

Enter your business-specific numbers, including revenue projections, costs, and investment details. The pre-built formulas will automatically calculate financial insights, saving you time and effort.

Leverage the investor-ready format to confidently showcase your financial projections to banks, franchise representatives, or investors. Impress stakeholders with clear, data-driven insights and professional reports.

Leverage the investor-ready format to confidently present your projections to banks, franchise representatives, or investors.