
All-in-one Dashboard
Core inputs and core outputs


This franchise financial model provides a complete Excel spreadsheet for franchise business feasibility, covering everything from initial build-out to five-year cash flow.
Core inputs and core outputs
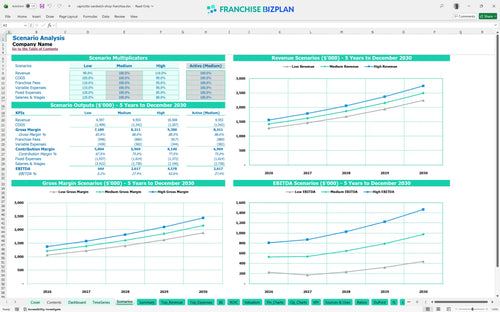
Three scenario analysis
Presentation ready

DuPont analysis
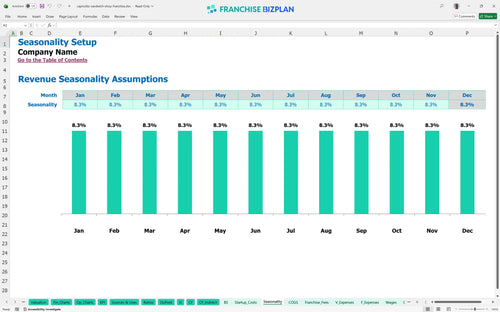
Researched revenue assumptions

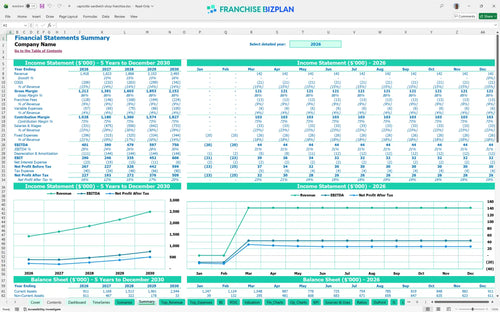
Lender-friendly financial outputs

Revenue stream detailed view
Performance metrics benchmark
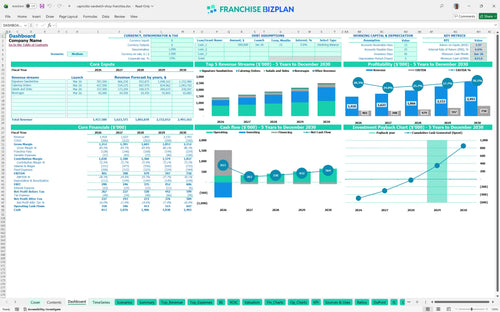
We built this financial model template for sandwich shop franchise units using detailed research into high-volume deli operations. Key assumptions like the $1.418M year-one revenue and 7% royalty fees are pre-populated with researched data and are fully editable to match your specific location. This tool helps you move from a vague idea to a concrete franchise business plan template.
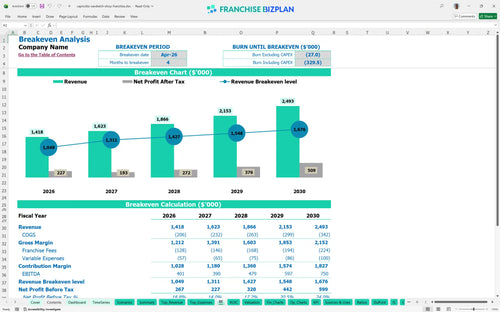
Based on the data, the unit hits its break-even point in April 2026, just four months after opening. With year-one EBITDA projected at $401,000, the model shows a steady climb as you master profitability metrics for high-volume sandwich shops and food costs drop to 11.7% by year five. Speed to profit is the only metric that keeps the lights on early.
You'll need significant capital to get the doors open, with leasehold improvements and roasting equipment totaling over $460,000. When you add the $40,000 franchise fee and initial working capital, the model tracks how these funds are deployed before the first sub is sold. Your biggest checks are written before the first customer walks in.
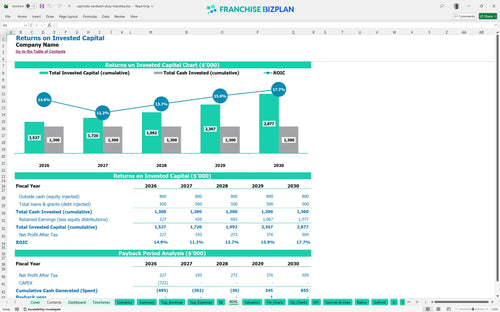
This restaurant franchise unit economic forecast shows a 4-year payback period and an internal rate of return (IRR) of 4.59%. While the initial ROE is 1.97, the long-term value sits in the $750,000 annual EBITDA potential as the brand matures in the local market. Patience is a financial virtue when looking at a four-year payback.
The monthly break-even point is reached in month 4, driven heavily by the $18,000 monthly rent and the $130,000 combined annual salary for management. High-margin items like beverages and sides help offset the fixed labor burden during the early ramp-up phase. Break-even is a milestone, not a destination.
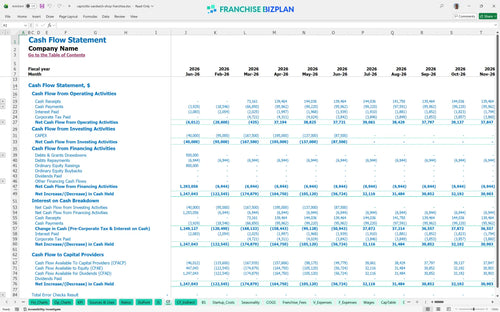
The lowest cash point occurs in June 2026 at $623,000, which includes your initial investment and early operating losses. It is defintely smart to keep a 6-month runway because if leasehold improvements take longer than planned, your burn rate will spike before revenue kicks in. Cash is oxygen; don't run out of air during the climb.
The model allows for financial planning for multi-unit food franchises across three scenarios. A 'High' case assumes you successfully learn how to estimate catering profit margins for franchises, which significantly improves year-one margins, while the 'Low' case tests your ability to survive if signature sandwich sales stay under $500,000. Hope is not a strategy, but a high-case scenario is a goal.
Finance: update unit break-even and payback model by Friday
This franchise financial model is built in Excel, letting you tweak every variable from signature sandwich prices to hourly wages for your delivery drivers. You can adjust the pre-filled formulas to match your specific territory or local labor market without breaking the underlying logic. Control your data, control your destiny.

Map out your path from grand opening to year five with detailed franchise unit financial projections. The model tracks how scaling from $1.4M to $2.4M in annual sales impacts your bottom line as fixed operating expenses like your $18,000 monthly rent stabilize over time. Five years is a lifetime in food, so plan for the long haul.

Don't let off-the-top costs surprise you during your sandwich shop profit analysis. This tool calculates the 7% royalty fees and 2% marketing fund contributions automatically based on your gross sales, ensuring you see the net cash available after the franchisor takes their cut. Royalties are the price of admission; manage them or they'll manage you.

Use this to figure out how to calculate startup costs for a food franchise, including the $350,000 leasehold improvements and $110,000 in specialized roasting ovens. It identifies the exact sales volume needed to cover your fixed costs and helps you visualize the break-even point. Knowing your zero-day is the difference between sleeping and staring at the ceiling.

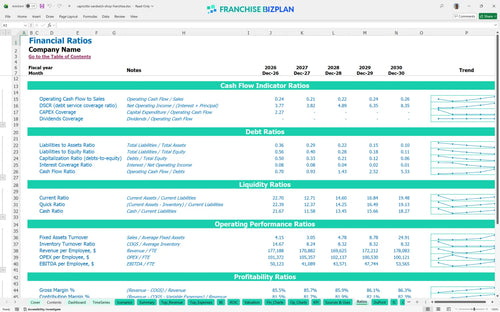
We've baked in industry standards so you can compare your food cost analysis against typical fast-casual ranges. If your food ingredients are hitting 12.5% in year one, you'll know exactly how that stacks up against the model's baseline for high-volume deli operations. Don't guess when you can benchmark.


Simply purchase and download the financial model template, then access it instantly using Microsoft Excel or Google Sheets. No installation or technical expertise required-just open and start working.

Enter your business-specific numbers, including revenue projections, costs, and investment details. The pre-built formulas will automatically calculate financial insights, saving you time and effort.

Leverage the investor-ready format to confidently showcase your financial projections to banks, franchise representatives, or investors. Impress stakeholders with clear, data-driven insights and professional reports.

Leverage the investor-ready format to confidently present your projections to banks, franchise representatives, or investors.