
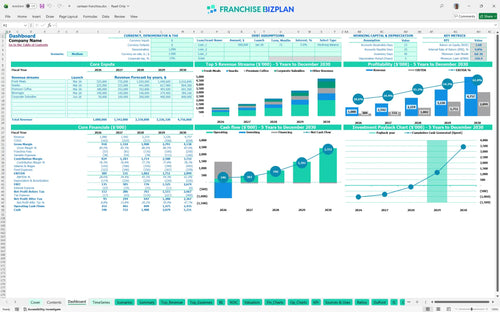
All-in-one Dashboard
Core inputs and core outputs


The franchise unit financial model template provides a professional-grade Excel template for franchise financial projections, covering everything from initial CAPEX to five-year EBITDA growth.
Core inputs and core outputs
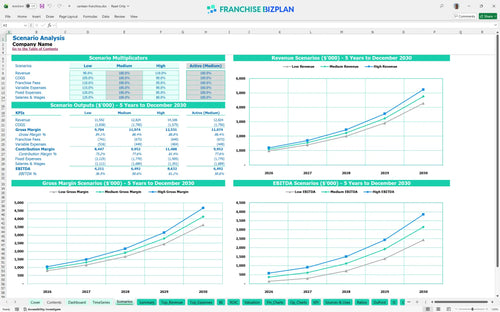
Three scenario analysis
Presentation ready
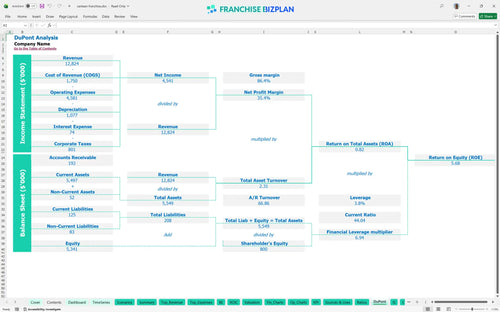
DuPont analysis
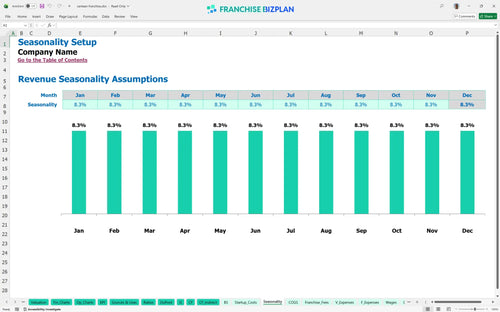
Researched revenue assumptions
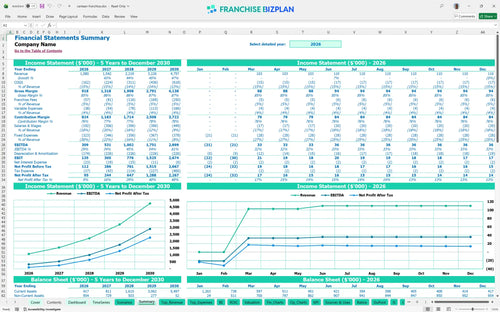
Lender-friendly financial outputs
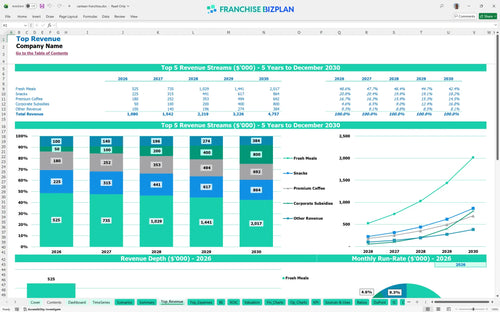
Revenue stream detailed view
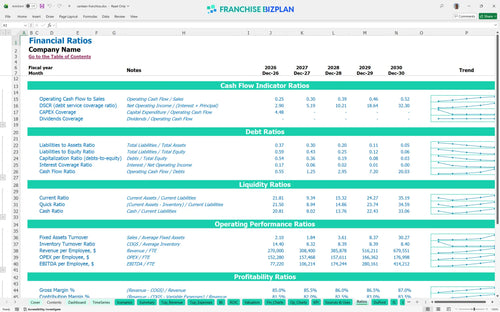
Performance metrics benchmark
We built this franchise unit financial model using extensive research into unattended retail and corporate refreshment trends. Key assumptions for revenue streams like fresh meals and premium coffee, along with operating expenses and the $3,250 franchise fee, are pre-populated and fully editable to match your specific market. This data-driven approach ensures you can track the path from a $316,000 low cash point to a $2.89M Year 5 EBITDA.
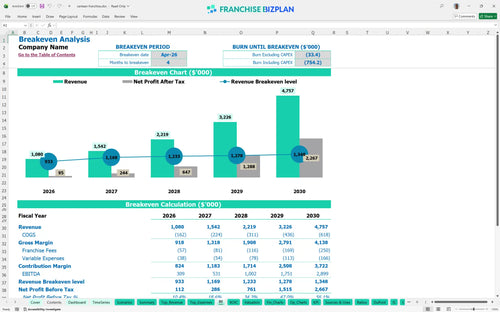
This franchise unit is projected to reach profitability by April 2026, just four months after the initial launch. By Year 5, the model estimates a net EBITDA of $2,899,000 as the unit scales through high-margin premium coffee and corporate subsidy programs.
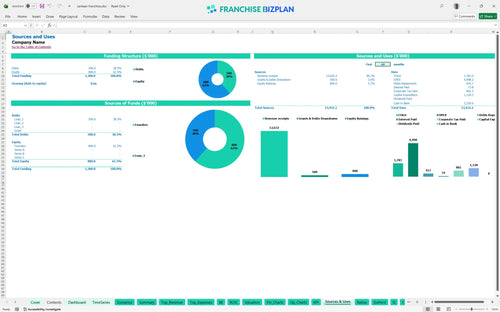
Launching a unit in a premium US tech corridor requires a total initial investment of approximately $1.15M, including $450,000 for micro-market technology and $250,000 for leaseholds. The model accounts for a $3,250 franchise fee and $25,000 in initial inventory to ensure a smooth opening phase.
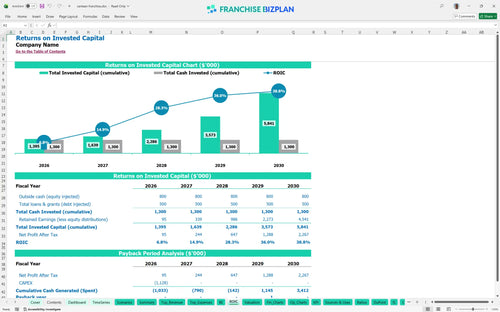
The franchise investment analysis spreadsheet indicates a 4-year payback period and an internal rate of return (IRR) of 4.83%. While the initial capital outlay is high, the return on equity (ROE) of 5.68% reflects the long-term stability of the unattended retail business model.
The monthly break-even point is reached in month 4, primarily driven by the high volume of fresh meal sales which are projected at $350,000 in the first year. The $18,000 monthly rent is the largest fixed cost hurdle, making site selection and foot traffic the most critical factors for success.
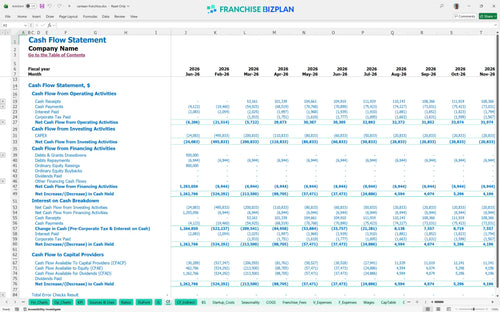
The lowest cash point is $316,000 in July 2026, suggesting you need a healthy buffer to handle the ramp-up after the initial $1.1M investment. Financial forecasting for unattended retail units shows that while the model turns cash-positive quickly, the initial CAPEX creates significant early pressure.
In a high-growth scenario, hitting the $4.75M Year 5 revenue target early significantly boosts your IRR and shortens the 4-year payback. Conversely, if inventory costs stay at 13.5% instead of dropping to 11.5%, your store-level margin will defintely tighten, requiring more aggressive B2B sales to maintain cash flow.
This franchise unit financial model is built in Excel with fully editable assumptions, allowing you to swap out pre-filled data for your specific territory. You can adjust revenue drivers, labor costs, and local rent to see how different operating scenarios impact your bottom line in real time.

Planning for long-term growth is essential when managing unattended retail business model assets that depreciate over time. This model provides a detailed five-year outlook, tracking your journey from a $1.08M opening year to a projected $4.75M in annual sales as you scale your footprint.

The model accurately captures your ongoing obligations, including the 4.25% royalty and 1% marketing fund contribution, to show the true cost of brand alignment. By automating these calculations, you can focus on managing your store-level margin rather than getting lost in the math of franchise compliance.

Use the franchise startup cost calculator to map out the $1.1M+ required for technology, refrigeration, and leasehold improvements before you serve your first customer. Knowing your break-even point for franchise operations helps you manage the 4-month ramp-up period with confidence and precision.

This tool includes unit economics analysis benchmarks to help you sanity-check your 13.5% inventory procurement costs against industry standards. It allows you to compare your $75,000 operations manager salary and $18,000 monthly rent against typical ranges for high-traffic tech corridor locations.


Simply purchase and download the financial model template, then access it instantly using Microsoft Excel or Google Sheets. No installation or technical expertise required-just open and start working.

Enter your business-specific numbers, including revenue projections, costs, and investment details. The pre-built formulas will automatically calculate financial insights, saving you time and effort.

Leverage the investor-ready format to confidently showcase your financial projections to banks, franchise representatives, or investors. Impress stakeholders with clear, data-driven insights and professional reports.

Leverage the investor-ready format to confidently present your projections to banks, franchise representatives, or investors.