
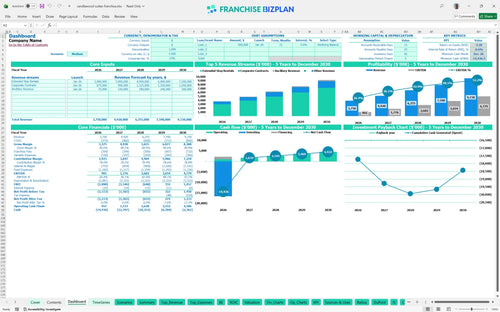
All-in-one Dashboard
Core inputs and core outputs


This comprehensive franchise unit financial model template provides a complete framework for forecasting revenue, managing multi-million dollar construction budgets, and analyzing five-year profitability.
Core inputs and core outputs
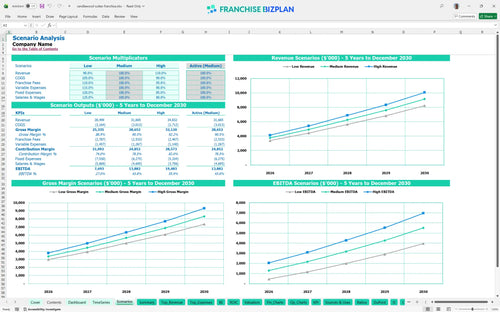
Three scenario analysis
Presentation ready
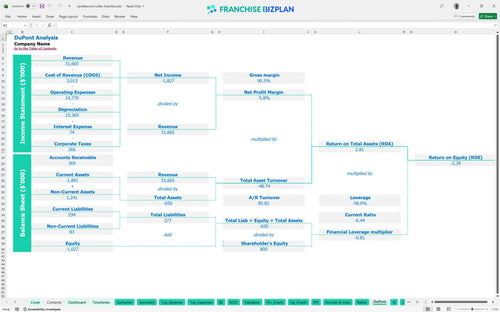
DuPont analysis
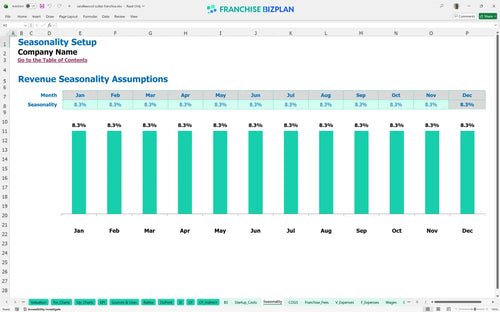
Researched revenue assumptions
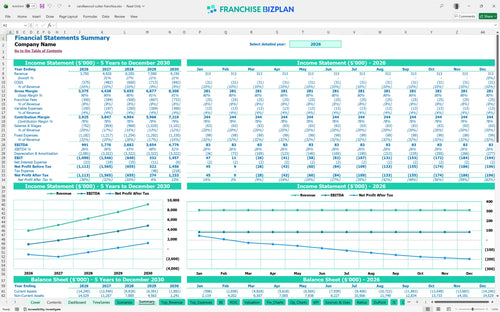
Lender-friendly financial outputs
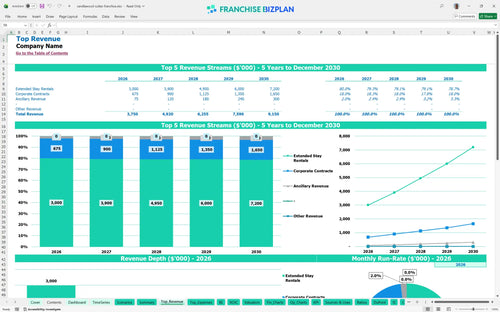
Revenue stream detailed view
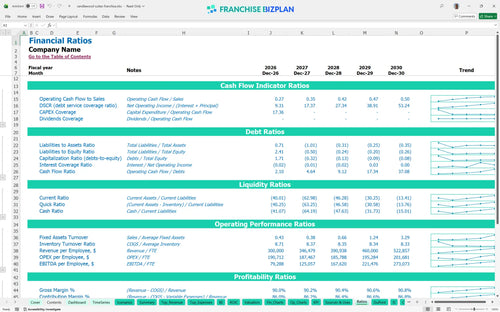
Performance metrics benchmark
We developed this financial model template for hotel franchise startup using detailed research into the extended stay sector. Key assumptions like the $60,000 franchise fee and $16.6M in total startup costs are pre-populated and fully editable to match your specific territory. With Year 1 revenue projected at $3.75M and EBITDA scaling to $4.779M by Year 5, this tool provides a clear roadmap for your investment.
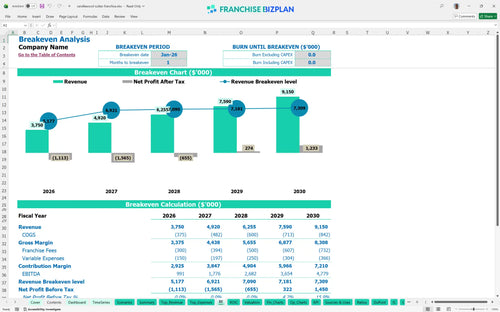
The unit reaches a technical break-even in January 2026, but true net profitability depends on scaling your Year 1 $3.75M revenue toward the $9.15M Year 5 target. After accounting for the 5.5% royalty and 8% total variable costs, EBITDA margins improve significantly as the asset matures.
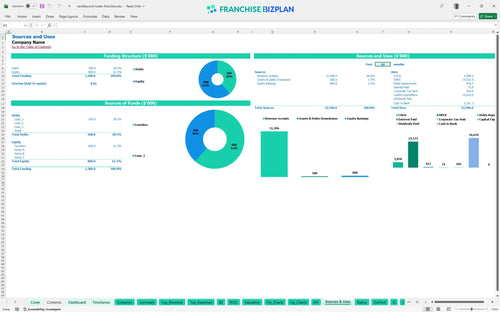
Launching this extended stay hotel requires approximately $16.6M in total capital, primarily driven by property acquisition and construction. This includes $4.5M for the land, $7.5M for the build-out, and $2.2M for suite furnishings to meet brand standards.
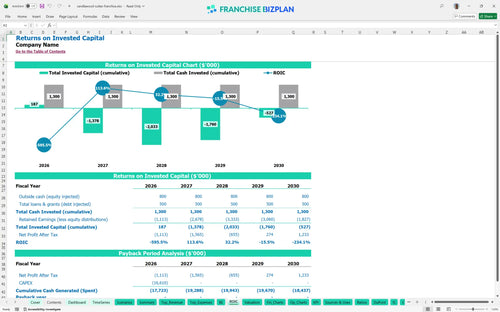
Investors should expect a longer payback period extending beyond Year 5 due to the heavy $16.6M initial investment. The model shows an IRR of -0.64% over the first five years, suggesting this is a long-term play focused on asset value and steady EBITDA growth.
The monthly break-even point is reached in the first month of operations, Jan-26, assuming you hit your initial occupancy targets. The primary driver for break-even is maintaining a high average daily rate to cover the $50,000 monthly lease and $18,000 utility burden.
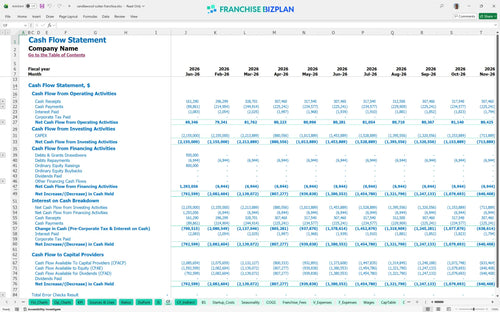
The lowest cash point hits a deficit of $14.4M in December 2026, which means you defintely need a robust financing plan or significant equity. You should maintain a six-month operating buffer to handle the ramp-up phase before the $4.7M Year 5 EBITDA kicks in.
In a High scenario where Year 5 revenue exceeds $9.15M, the payback period tightens significantly and the IRR turns positive sooner. Conversely, a Low scenario with 10% lower occupancy would increase the peak cash need and delay profitability timing by several months.
Finance: update unit break-even and payback model by Friday
This hotel franchise financial template is built in Excel, allowing you to adjust every variable from nightly rates to housekeeping schedules. It features pre-filled formulas and editable assumptions that make it simple to simulate different occupancy levels and local market conditions without building a spreadsheet from scratch.

Long-term planning is essential for an extended stay hotel franchise model because these assets involve significant upfront capital and gradual stabilization. This model provides a detailed 5-year outlook on revenue, costs, and cash flow, helping you see the transition from construction to a mature, cash-flowing property.

The model accurately tracks franchise-specific costs, including the 5.5% royalty and 2.5% marketing fund contributions, so you know exactly what remains for your local overhead. It simplifies the math on monthly brand obligations to ensure your franchise unit profit and loss template reflects the true cost of the brand partnership.

Estimating the total initial investment is the first step in any franchise investment analysis spreadsheet, especially with build-out costs reaching into the millions. This tool helps you pinpoint the exact sales volume required to cover your $50,000 monthly rent and $12,500 in property taxes.

We included industry-standard benchmarks for hospitality metrics to help you sanity-check your projections for guest supplies and labor. Comparing your expected performance against these ranges ensures your financial planning guide for hospitality franchisees stays grounded in reality. Every dollar saved in the laundry room directly boosts your store-level margin.


Simply purchase and download the financial model template, then access it instantly using Microsoft Excel or Google Sheets. No installation or technical expertise required-just open and start working.

Enter your business-specific numbers, including revenue projections, costs, and investment details. The pre-built formulas will automatically calculate financial insights, saving you time and effort.

Leverage the investor-ready format to confidently showcase your financial projections to banks, franchise representatives, or investors. Impress stakeholders with clear, data-driven insights and professional reports.

Leverage the investor-ready format to confidently present your projections to banks, franchise representatives, or investors.