
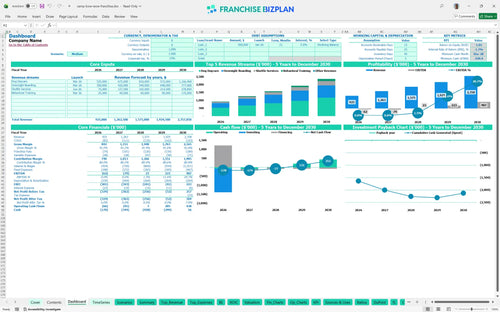
All-in-one Dashboard
Core inputs and core outputs


This comprehensive pet care franchise profitability analysis includes dynamic Excel tabs for revenue forecasting, detailed CAPEX tracking, and five-year P&L statements tailored for high-end pet hospitality units.
Core inputs and core outputs
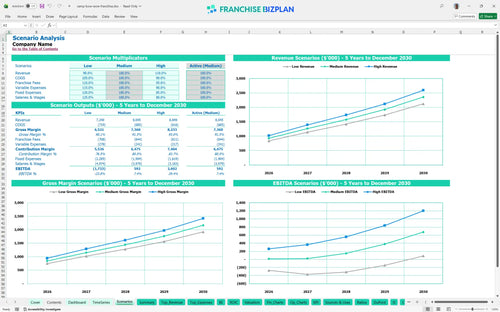
Three scenario analysis
Presentation ready
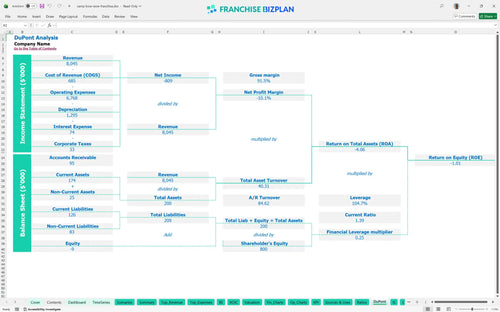
DuPont analysis
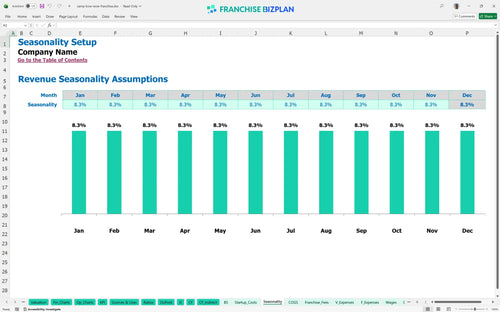
Researched revenue assumptions
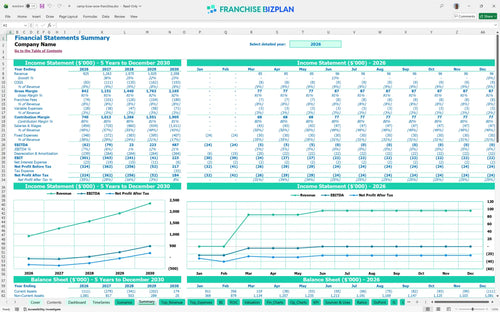
Lender-friendly financial outputs
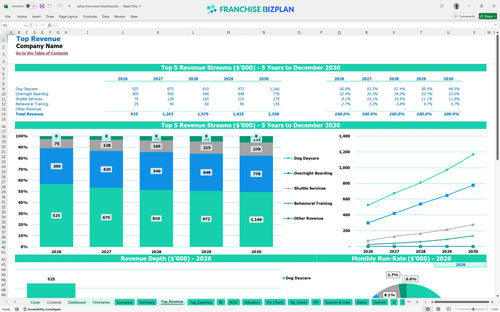
Revenue stream detailed view
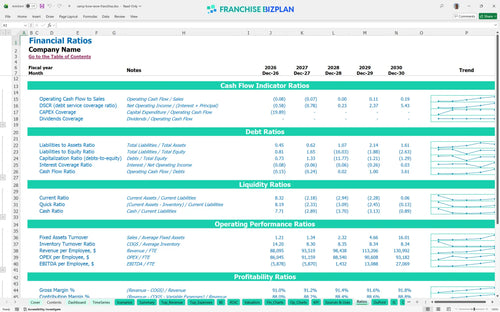
Performance metrics benchmark
We built this franchise unit financial model using intensive research to reflect the high-capital nature of premium pet boarding. Key assumptions like the $650,000 build-out cost and $1.26 million year-two revenue are pre-populated and fully editable to help you evaluate this investment opportunity with precision.
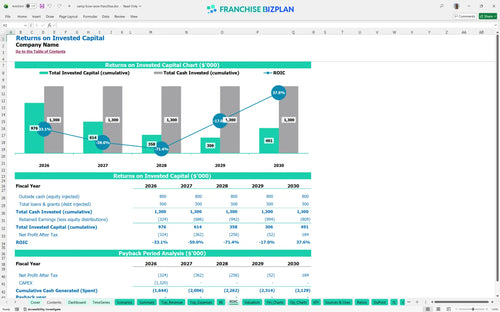
This franchise unit reaches EBITDA profitability in year three, generating a projected $23,000 after covering all operating costs and royalties. While year one and two show losses as you ramp up traffic, the model projects a significant jump to $487,000 in EBITDA by year five.
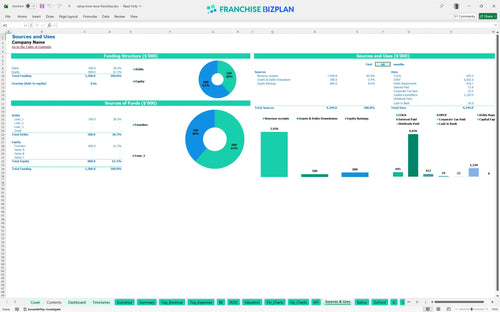
You need approximately $1.32 million to launch this unit, with the largest portion dedicated to facility leasehold improvements and specialized play yards. This total includes the $50,000 initial franchise fee and $150,000 for climate control systems essential for pet safety.
The model indicates a payback period occurring after year five, with a projected internal rate of return of -1.71% over the initial five-year window. While the upfront investment is heavy, the year-five net margin shows strong performance as the unit reaches maturity.
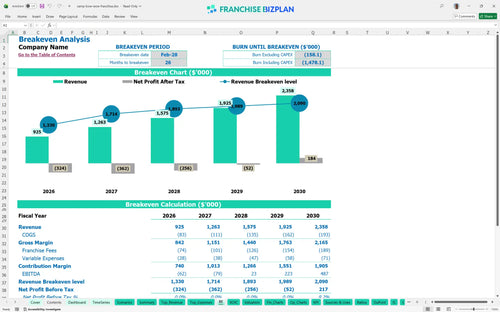
The unit hits its monthly break-even point in February 2028, which is 26 months after the initial start of the project. Reaching this milestone depends heavily on managing the $18,000 monthly rent and ensuring the shuttle service drives high-volume daycare traffic.
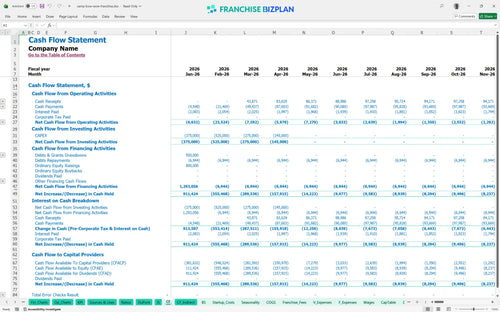
The lowest cash point occurs in December 2028 at -$420,000, meaning you need a substantial working capital buffer to survive the ramp-up phase. You should plan for at least 30 months of runway to cover losses before the unit becomes self-sustaining.
The High scenario accelerates your move to the $2.3 million revenue mark, significantly improving your year-five margin and peak cash needs. Conversely, the Low scenario could push your breakeven date further out, making labor productivity and local marketing execution critical to your success.
Finance: update unit break-even and payback model by Friday.
This dog daycare franchise financial model is defintely built for flexibility in Excel, allowing you to swap out pre-filled research for your own local data. You can adjust every assumption from boarding rates to counselor headcount to see how different operating scenarios impact your bottom line.

Plan your multi-year growth with detailed forecasts that track revenue scaling from $925,000 in year one to over $2.3 million by year five. The model provides a clear view of long-term cash flow and profit potential for a single unit or a small cluster of locations.

The model automatically calculates your ongoing obligations, including the 7% royalty and 1% marketing fund contributions based on gross sales. This ensures you understand exactly how much off-the-top expense goes to the franchisor before you cover your local Scottsdale rent and labor.

Estimate your total initial investment, which includes the $50,000 franchise fee and significant leasehold improvements, to find your exact break-even point. This dog daycare investment calculator helps you determine the monthly volume needed to cover the $18,000 facility rent and other fixed costs.

Use integrated pet industry benchmarks to verify if your counselor wages or cleaning supply costs are in line with high-performing units. These standards help you identify margin leaks early and adjust your unit economics modeling for better store-level performance.


Simply purchase and download the financial model template, then access it instantly using Microsoft Excel or Google Sheets. No installation or technical expertise required-just open and start working.

Enter your business-specific numbers, including revenue projections, costs, and investment details. The pre-built formulas will automatically calculate financial insights, saving you time and effort.

Leverage the investor-ready format to confidently showcase your financial projections to banks, franchise representatives, or investors. Impress stakeholders with clear, data-driven insights and professional reports.

Leverage the investor-ready format to confidently present your projections to banks, franchise representatives, or investors.