
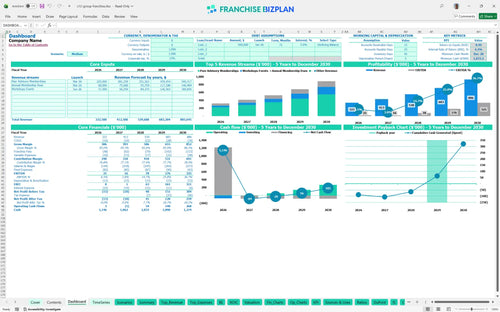
All-in-one Dashboard
Core inputs and core outputs


This comprehensive toolkit provides a pro forma financial statements for franchise owners, covering everything from initial CAPEX to five-year EBITDA growth.
Core inputs and core outputs
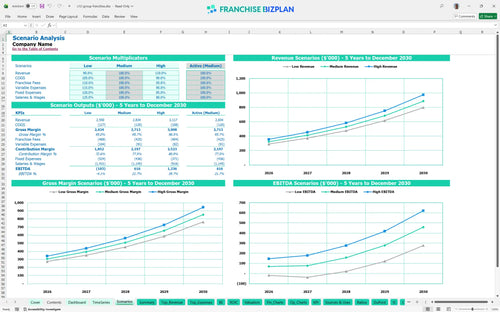
Three scenario analysis
Presentation ready
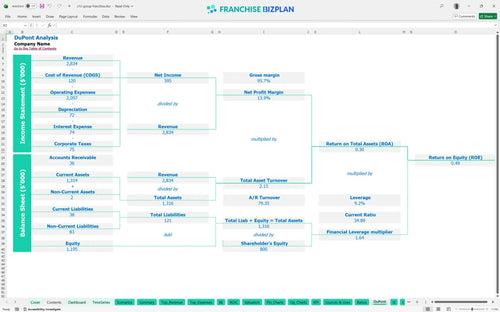
DuPont analysis
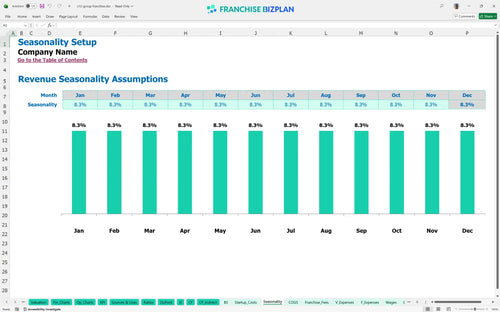
Researched revenue assumptions
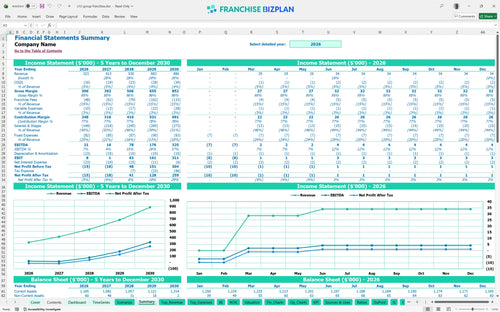
Lender-friendly financial outputs
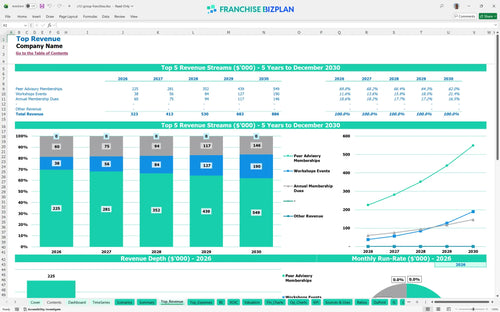
Revenue stream detailed view
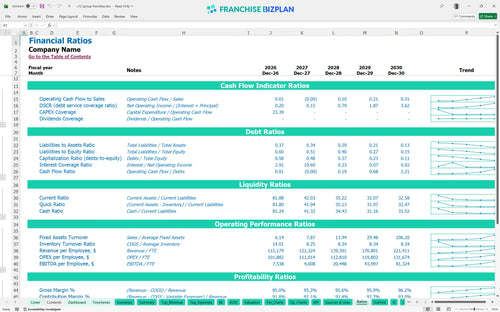
Performance metrics benchmark
We built this financial model for executive coaching franchise units based on detailed research into professional advisory service economics. The model comes pre-populated with data like the $323,000 year-one revenue target and the 15% royalty structure, but every cell is fully editable to fit your local market. It's designed to give you a realistic look at store-level margins and long-term cash requirements.
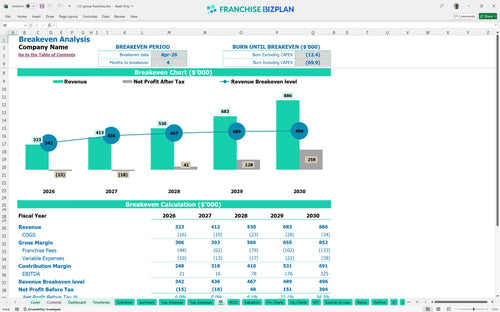
This unit reaches a positive EBITDA of $21,000 in its first year and scales significantly to $325,000 by year five as membership density increases. We estimate the unit becomes profitable quickly after accounting for the 15% royalty and fixed costs like the $75,000 facilitator salary. Speed to profit is the only metric that truly matters.
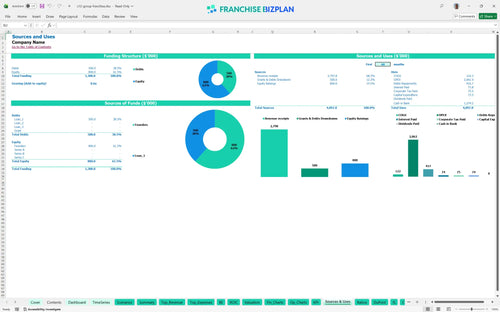
To launch this unit, you need to cover the $40,000 franchise fee plus roughly $33,500 in physical setup costs like leaseholds and furniture. This franchise unit profitability spreadsheet accounts for these upfront costs plus the working capital needed to reach your April 2026 breakeven. Cash is oxygen for a new territory.
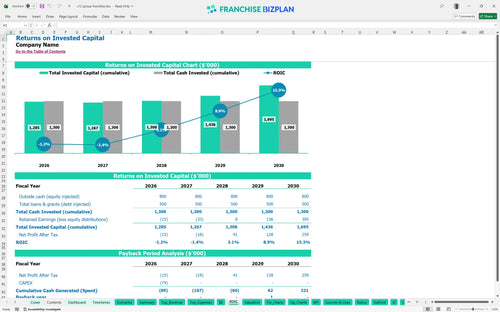
Investors can expect an internal rate of return (IRR) of 4.22% with a total payback period of 4 years. While the initial return on equity is 0.49, the long-term value is defintely tied to the scaling EBITDA which grows 15x between year one and year five. Patience pays when the IRR is positive.
The model shows a break-even date of April 2026, just four months after the January launch. This fast ramp-up depends on hitting your initial membership targets to cover the $6,850 in monthly fixed operating expenses. Volume is the lever that moves the needle.
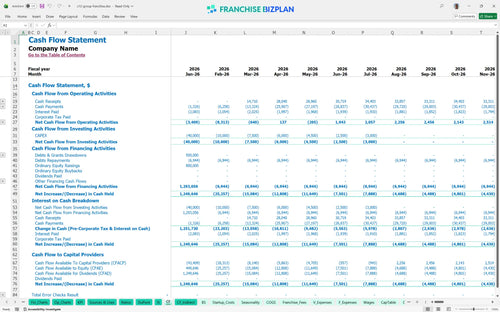
The lowest cash point is projected at $1,033,000 in December 2028, suggesting a significant capital buffer is maintained throughout the growth phase. This financial forecasting for service-based franchises ensures you have enough runway to handle the timing gaps between member billing and facilitator payroll. The lowest point is where most fail.
Using an Excel template for franchise financial projections allows you to see how a 10% drop in membership affects your $21,000 year-one EBITDA. High-growth scenarios significantly improve the 4.22% IRR by leveraging the fixed-cost nature of the office and staff. Execution separates the high case from the low case.
This franchise financial model template is built in Excel, allowing you to tweak every variable from member growth to event pricing. You can adjust the pre-filled formulas and editable assumptions to match your specific territory, whether you are in a high-cost hub or a growing suburb. It's a plug-and-play tool for serious operators.

Plan your growth with detailed 5-year revenue, cost, and cash flow forecasts designed for professional service models. This franchise business plan tool maps out your path from the first $323,000 in year one to a projected $886,000 by year five. Five years of foresight beats five months of guessing.

This model tracks your realy heavy obligations, including the 15% royalty fee and the initial $40,000 franchise fee. By integrating these into your franchise unit budget template, you can see exactly how much cash stays in your pocket after the franchisor takes their cut. Royalties are a top-line hit you can't ignore.

Use our franchise startup cost calculator to estimate your total initial investment, including leasehold improvements and AV equipment. The model performs a detailed calculating break-even point for a new franchise so you know exactly when your membership dues cover your $4,500 monthly rent. Knowing your number keeps the lights on.

The model includes built-in franchise profitability analysis metrics to help you sanity-check your operating expense budget against industry standards. You can compare your facilitator salaries and office costs to ensure your margins stay healthy as you scale. Don't fly blind when you can use proven data.


Simply purchase and download the financial model template, then access it instantly using Microsoft Excel or Google Sheets. No installation or technical expertise required-just open and start working.

Enter your business-specific numbers, including revenue projections, costs, and investment details. The pre-built formulas will automatically calculate financial insights, saving you time and effort.

Leverage the investor-ready format to confidently showcase your financial projections to banks, franchise representatives, or investors. Impress stakeholders with clear, data-driven insights and professional reports.

Leverage the investor-ready format to confidently present your projections to banks, franchise representatives, or investors.