
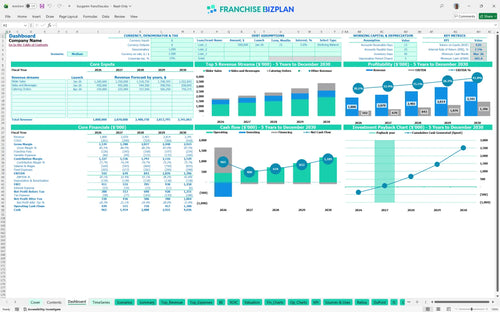
All-in-one Dashboard
Core inputs and core outputs


This comprehensive franchise startup cost template includes everything an operator needs to project 5-year performance, manage multi-unit franchise budgeting, and analyze store-level profitability.
Core inputs and core outputs
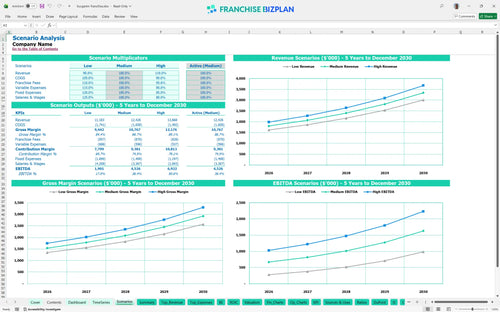
Three scenario analysis
Presentation ready
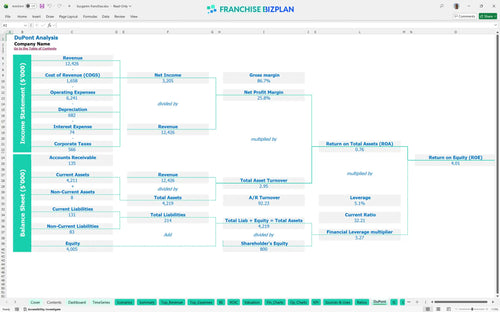
DuPont analysis
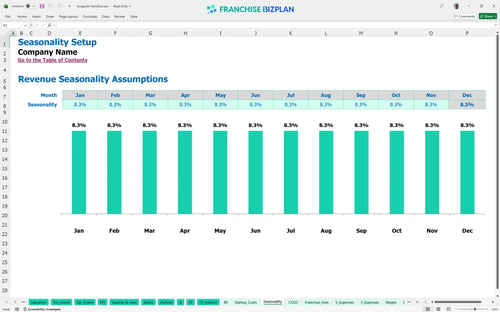
Researched revenue assumptions
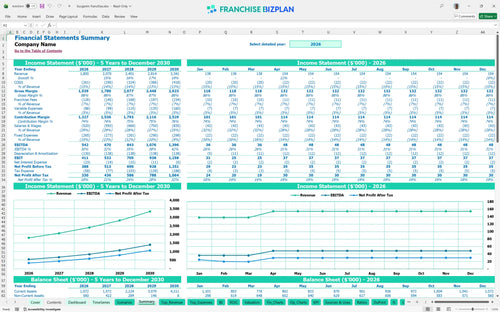
Lender-friendly financial outputs
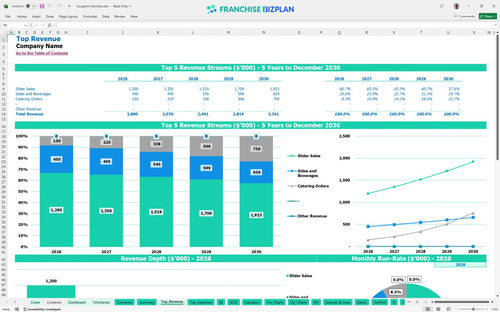
Revenue stream detailed view
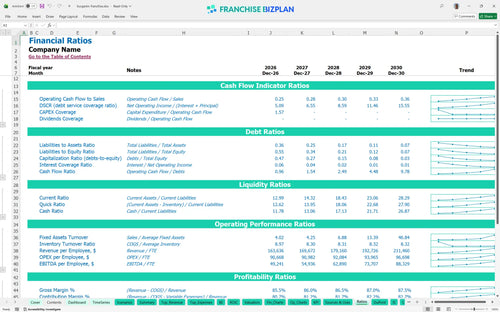
Performance metrics benchmark
We built this franchise unit financial model using deep research into the slider-based fast-casual sector. Key assumptions, including year-one revenue of $1.8M and a 6% royalty structure, are pre-populated and fully editable to fit your specific Austin or urban market. This is the blueprint for your bank meeting.
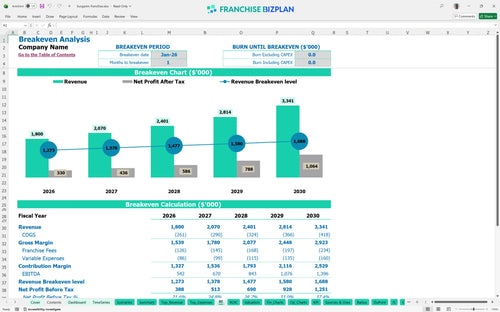
The unit hits profitability almost immediately, with a break-even date of January 2026. By year two, EBITDA is projected to reach $670,000 as catering orders scale from $100k to $150k annually. Early profitability is the ultimate goal.
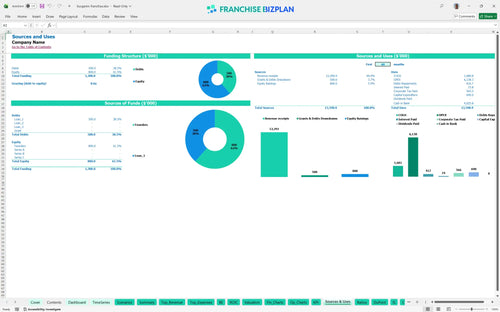
You need a total initial investment of approximately $690,000 to launch this unit. This covers the $70,000 franchise fee, $280,000 for leasehold improvements, and $160,000 for kitchen equipment like grills and fryers. Know where every dollar goes before you sign.
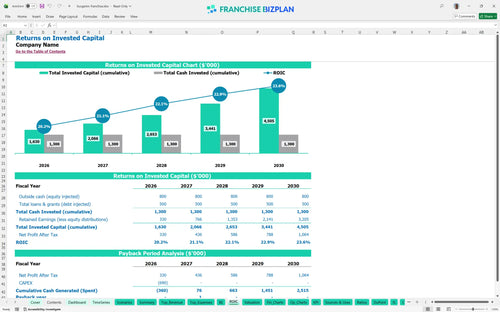
The model shows a 2-year payback period and an internal rate of return (IRR) of 7.05%. With a return on equity (ROE) of 4.01, the franchise profitability analysis suggests steady long-term gains as revenue climbs toward $3.3M. Cash is king, but ROI is the scoreboard.
The monthly break-even is achieved in the first month of trading, provided you hit the $1.8M annual revenue target. The primary driver is volume, as you must cover $22,100 in monthly fixed costs including $16,000 for prime location rent. Volume cures almost every operational sin.
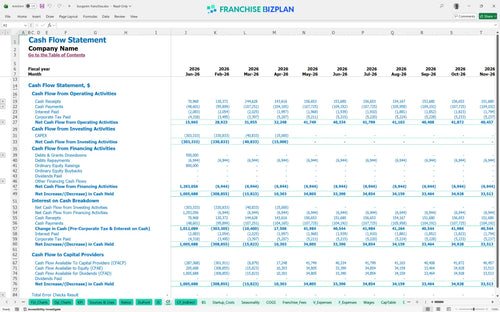
The lowest cash point is $681,000 in March 2026, which is three months into operations. You need to manage your franchise investment capital carefully during this ramp-up to ensure payroll for your 11+ staff members is always met. Watch your cash like a hawk during month three.
Switching to a high-growth scenario could push year-one EBITDA well past $542,000 if local marketing execution drives higher traffic. Conversely, a low scenario might stretch the 2-year payback if delivery platform commissions eat more than the projected 2.5%. Plan for the worst, but execute for the best.
This franchise financial model is built in Excel with fully editable assumptions, allowing you to plug in your specific local data. You can adjust everything from slider pricing to hourly wages for your crew members, ensuring the projections match your specific territory and lease terms. Every cell is open for your input.

We provide a long-term roadmap that tracks your growth from an initial $1.8M in year-one revenue to a projected $3.3M by year five. This food service financial projection helps you visualize how store-level EBITDA scales as you optimize food costs and labor efficiency over time. Five years is a lifetime in the burger business.

The model simplifies estimating franchise royalty and marketing fees by applying the 6% and 1% rates directly to your gross sales. It also accounts for the $70,000 initial franchise fee, so you can see exactly how these brand obligations impact your monthly cash flow. Royalties are a permanent tax on your hustle.

Calculating break-even point for a burger restaurant is critical, and this tool identifies that you can hit it by January 2026. It aggregates your $280,000 leasehold improvements and $160,000 kitchen equipment costs to show the total mountain you need to climb. Speed to break-even is your best insurance policy.

Our model includes franchise unit economics benchmarks to help you sanity-check your $16,000 monthly rent and 12.5% food ingredient costs. By comparing your projected margins against industry standards, you can defintely spot if your labor or occupancy costs are out of alignment. Don't ignore what the data is screaming at you.


Simply purchase and download the financial model template, then access it instantly using Microsoft Excel or Google Sheets. No installation or technical expertise required-just open and start working.

Enter your business-specific numbers, including revenue projections, costs, and investment details. The pre-built formulas will automatically calculate financial insights, saving you time and effort.

Leverage the investor-ready format to confidently showcase your financial projections to banks, franchise representatives, or investors. Impress stakeholders with clear, data-driven insights and professional reports.

Leverage the investor-ready format to confidently present your projections to banks, franchise representatives, or investors.