
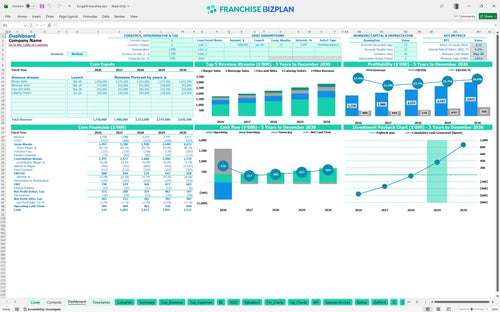
All-in-one Dashboard
Core inputs and core outputs


This tool provides a complete pro forma suite including dynamic revenue drivers, detailed labor scheduling, and a full CAPEX schedule for a single franchise unit.
Core inputs and core outputs
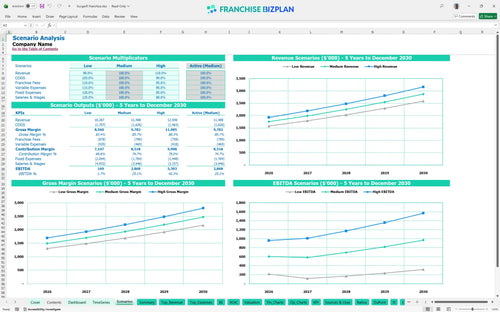
Three scenario analysis
Presentation ready
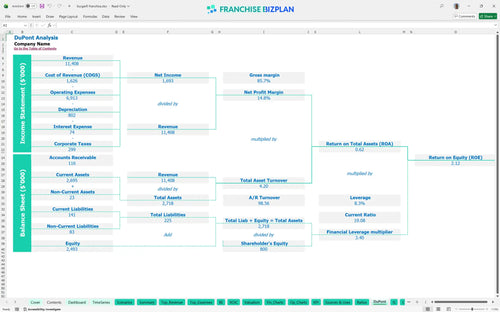
DuPont analysis
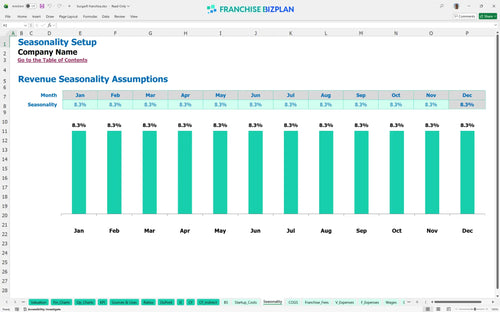
Researched revenue assumptions
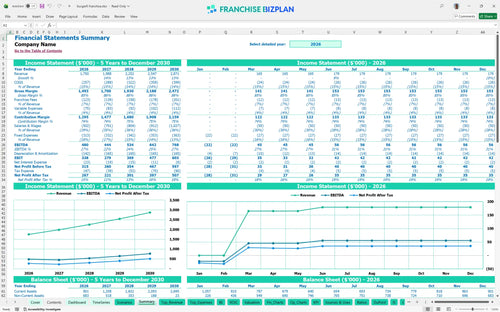
Lender-friendly financial outputs
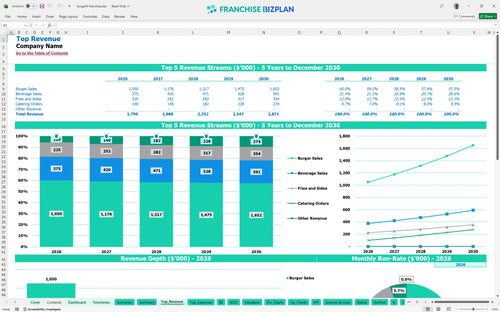
Revenue stream detailed view
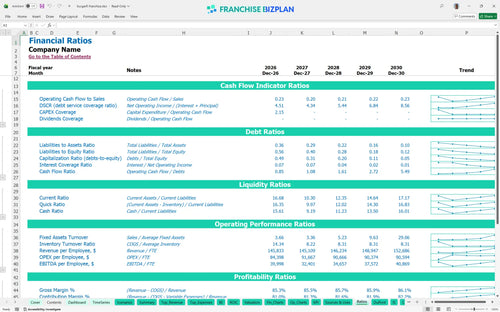
Performance metrics benchmark
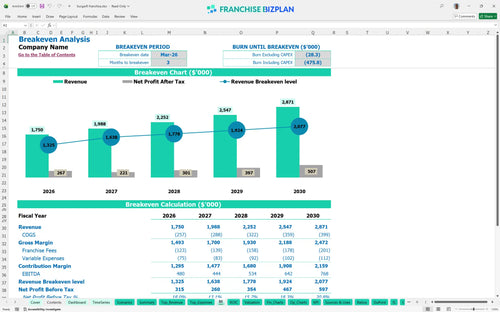
We built this franchise unit financial model using our own research into the fast-casual burger sector. Key assumptions, including the $1.75M year-one revenue and 5.5% royalty fees, are pre-populated with researched data specific to this burger franchise unit and are fully editable. Based on the data, the unit hits its break-even date in March 2026, just three months after launching.
The unit becomes profitable in its first year of operation, specifically hitting the break-even point in March 2026. This is calculated by netting out the 13% food costs, 5.5% royalties, and $20,000 monthly rent against the projected $1.75M in initial annual sales.
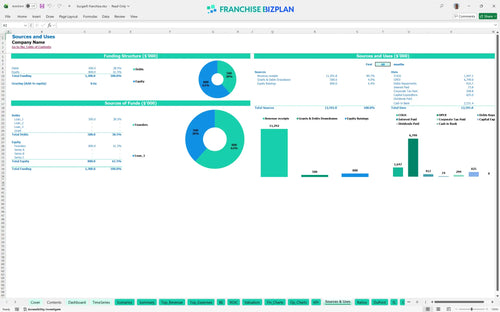
You will need to know how to calculate fast-casual franchise startup costs to cover the $825,000 in total CAPEX and initial franchise capital requirements. This includes the $35,000 franchise fee, $350,000 for leasehold improvements, and $120,000 for cooking equipment to ensure you are not underfunded during the build-out phase.
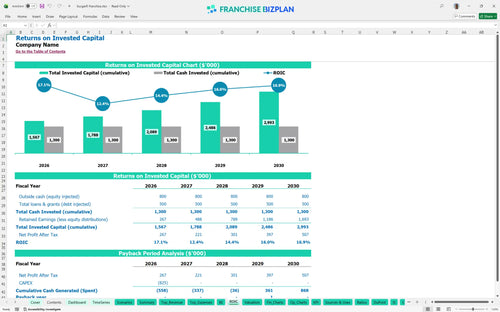
When calculating return on investment for food franchise units, this model shows an Internal Rate of Return (IRR) of 4.35% and a Return on Equity (ROE) of 2.12. You are also estimating profit margins for burger restaurant franchises that grow as EBITDA climbs from $480,000 in year one to $768,000 by year five, leading to a 4-year payback period.
The unit reaches monthly break-even in March 2026, which is month 3 of operations, but this requires a financial feasibility study for new franchise locations to ensure unit economics for restaurants stay on track. Your ability to hit this depends heavily on managing the $20,000 monthly rent and ensuring burger sales hit the $700,000 annual target.
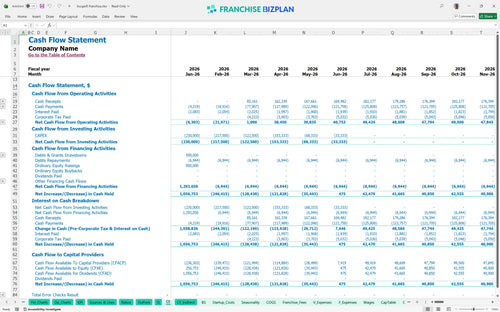
The lowest cash point occurs in May 2026, with a minimum cash balance of $525,000, so using a detailed franchise unit expense tracker template is critical. You will need a franchise unit cash flow projection template to manage the gap between the initial $825,000 build-out and the point where monthly cash flow turns positive.
This is the best financial model for multi-unit restaurant owners because it allows you to run a Franchise ROI analysis across Low, Medium, and High scenarios. Moving to a High scenario can significantly pull forward your payback date, especially if sales grow faster than the projected 13% annual clip and fixed costs like rent become a smaller percentage of revenue.
This franchise financial model template lives in Excel, so you can tweak every assumption to fit your specific territory. It comes with pre-filled formulas and an Excel template for restaurant franchise financial forecasting that makes it easy to adjust local rent or hourly wages to see how they impact your bottom line. It is built for operators who need to move fast without breaking the math.

Thinking five years out is the only way to survive in the fast-casual space, so we built a restaurant franchise business plan that scales with you. This model projects your revenue from $1.75M in year one up to $2.87M by year five, providing pro forma financial statements for franchise business plans that help you visualize the ramp-up phase. You will see exactly how your balance sheet and cash flow evolve as the unit matures and throughput increases.

Royalties and brand funds are off-the-top costs that can squeeze margins if you are not careful, making a detailed franchise investment analysis essential. This tool calculates a 5.5% royalty and a 1.5% marketing fee automatically based on your sales forecasts. By mapping these out early, you can see how much cash is actually left for your local operations after the franchisor gets their cut.

Launching a new location requires a clear view of your total checkbook cost before the first burger is sold, which is why we included a restaurant startup cost calculator. The model tracks everything from the $35,000 franchise fee to the $350,000 build-out and $120,000 in kitchen equipment. It then provides a break-even analysis for franchises to tell you exactly what sales volume you need to hit to stop losing money.

Do not guess on your labor or food costs when you can use a proven franchise unit profitability model. The template incorporates restaurant franchise labor and food cost forecasting based on industry standards to help you sanity-check your numbers. If your food ingredients are projected at 13% but the industry average is different, you will know where to dig in and optimize. It is like having a CFO look over your shoulder to make sure your plan is defintely realistic.


Simply purchase and download the financial model template, then access it instantly using Microsoft Excel or Google Sheets. No installation or technical expertise required-just open and start working.

Enter your business-specific numbers, including revenue projections, costs, and investment details. The pre-built formulas will automatically calculate financial insights, saving you time and effort.

Leverage the investor-ready format to confidently showcase your financial projections to banks, franchise representatives, or investors. Impress stakeholders with clear, data-driven insights and professional reports.

Leverage the investor-ready format to confidently present your projections to banks, franchise representatives, or investors.