
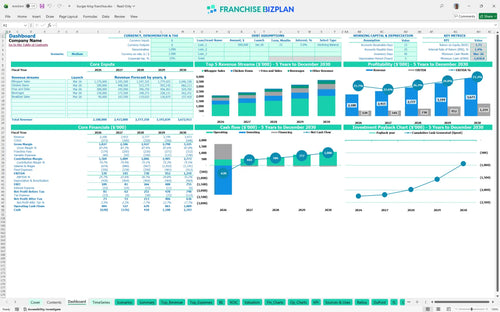
All-in-one Dashboard
Core inputs and core outputs


This franchise unit profitability analysis tool includes dynamic Excel tabs for CAPEX, staffing, revenue forecasting, and a full set of 5-year financial statements.
Core inputs and core outputs
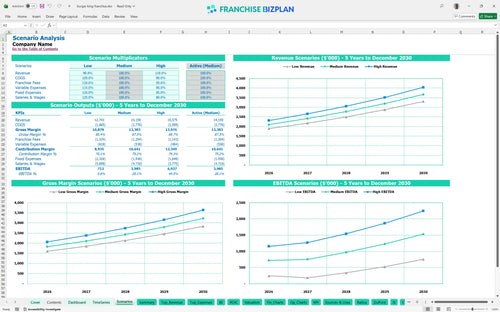
Three scenario analysis
Presentation ready
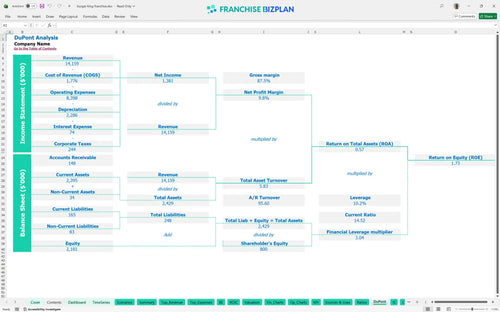
DuPont analysis
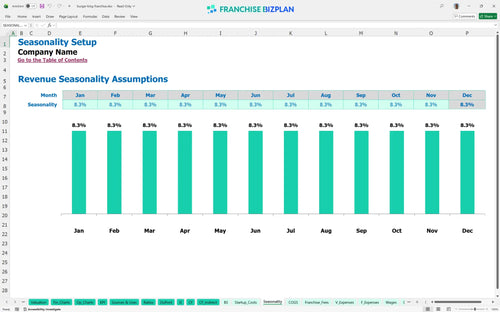
Researched revenue assumptions
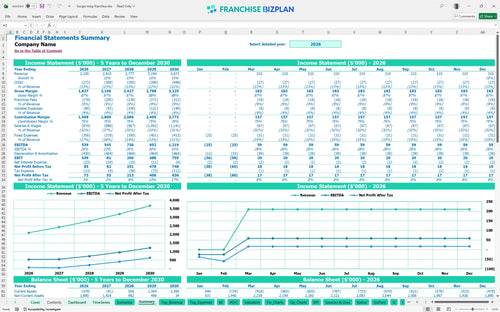
Lender-friendly financial outputs
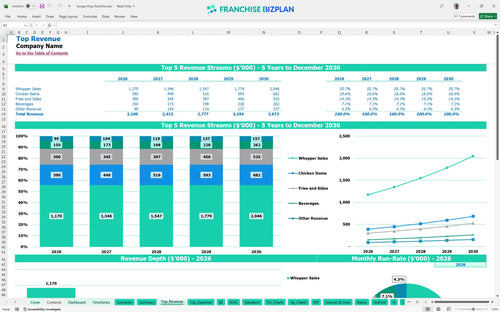
Revenue stream detailed view
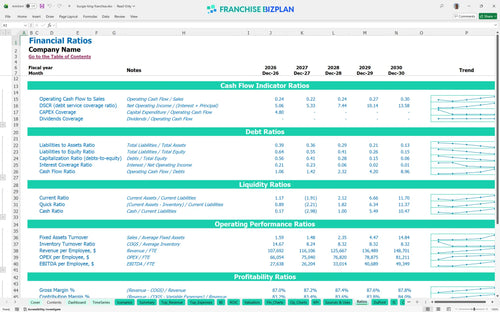
Performance metrics benchmark
We built this franchise unit financial model using deep research into the QSR sector to provide a defintely realistic planning tool. Key assumptions for revenue streams like burger and chicken sales, plus $2.32M in capital investments, are pre-populated and fully editable. You can use this to analyze a single unit starting at $2.1M in annual sales while tracking royalties and marketing fund contributions.
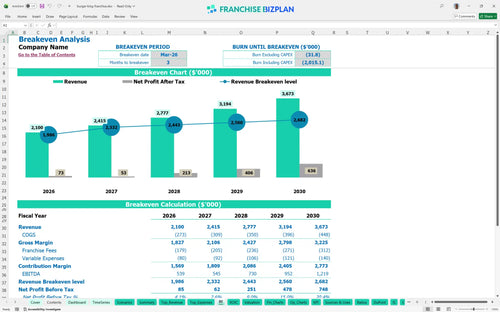
This unit becomes profitable in March 2026, just three months after the launch date. By year five, the model projects an annual EBITDA of $1,219,000 after accounting for all food costs, 4.5% royalties, and management salaries.
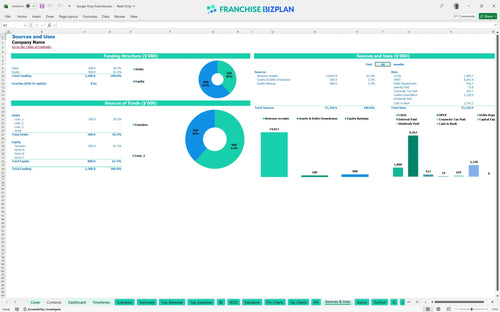
You need approximately $2,320,000 to launch this unit in the US. This covers the $50,000 franchise fee, $950,000 for leasehold improvements, and $450,000 for specialized flame-grilling equipment needed for operations.
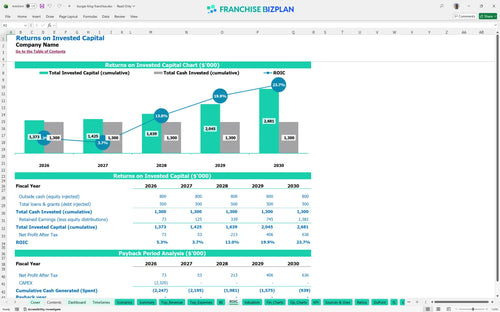
Investors can expect an Internal Rate of Return (IRR) of 1.41% and a Return on Equity (ROE) of 1.73%. Based on the heavy initial CAPEX, the full payback period occurs after the fifth year of operation.
The monthly break-even point is reached in March 2026. Reaching this level depends heavily on managing the $22,000 monthly rent and the 15.0 FTE crew member labor requirement during the initial ramp-up phase.
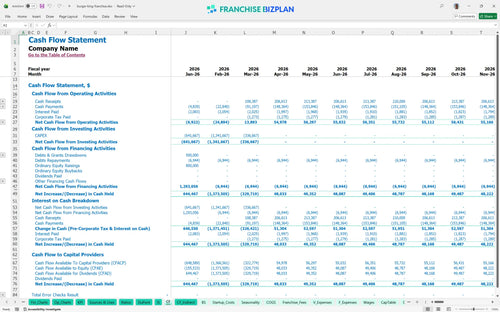
The lowest cash point is -$1,059,000 in March 2026, reflecting the heavy upfront investment before revenue scales. You need a significant cash buffer to handle the three-month gap between opening and reaching monthly break-even.
The model compares scenarios to show how a 10% revenue drop impacts the year-1 EBITDA of $539,000. High-performance scenarios significantly shorten the payback period by leveraging the fixed $22,000 rent against higher sales volumes.
Finance: update unit break-even and payback model by Friday
This fast food franchise financial model is built in Excel with fully editable assumptions and pre-filled formulas. You can easily adjust pricing, volume, and local overhead to match your specific territory and operating scenario without rebuilding the logic from scratch.

Map out your long-term growth with detailed 5-year revenue, cost, and cash flow forecasts. This QSR business plan template provides a clear view of how store-level EBITDA scales from $539,000 in year one to over $1.2 million by year five as the unit matures.

The model tracks every franchise-specific obligation to ensure you see the true net margin. It handles the initial $50,000 franchise fee along with the ongoing 4.5% royalty and 4.0% marketing fund contributions that impact your weekly cash flow.

Estimate your total restaurant startup financial projections by calculating the full build-out, equipment, and pre-opening costs. The model identifies the exact sales volume needed to cover your $22,000 monthly rent and fixed labor costs to reach the break-even point.

Sanity-check your unit-level economics against standard industry ranges for labor, food costs, and occupancy. The model uses researched data, like the 11% food ingredient cost and 2% packaging expense, to help you verify if your projections are realistic for a high-volume QSR.


Simply purchase and download the financial model template, then access it instantly using Microsoft Excel or Google Sheets. No installation or technical expertise required-just open and start working.

Enter your business-specific numbers, including revenue projections, costs, and investment details. The pre-built formulas will automatically calculate financial insights, saving you time and effort.

Leverage the investor-ready format to confidently showcase your financial projections to banks, franchise representatives, or investors. Impress stakeholders with clear, data-driven insights and professional reports.

Leverage the investor-ready format to confidently present your projections to banks, franchise representatives, or investors.