
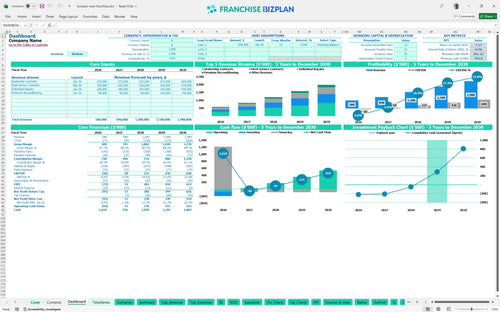
All-in-one Dashboard
Core inputs and core outputs


The franchise unit financial model template includes a complete set of integrated financial statements, CAPEX schedules, and scenario tools designed for mobile service operators.
Core inputs and core outputs
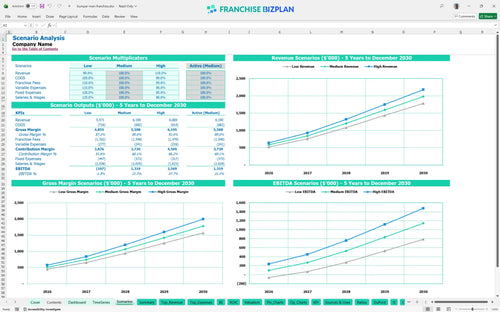
Three scenario analysis
Presentation ready
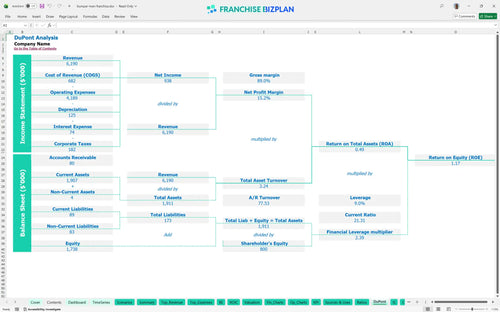
DuPont analysis
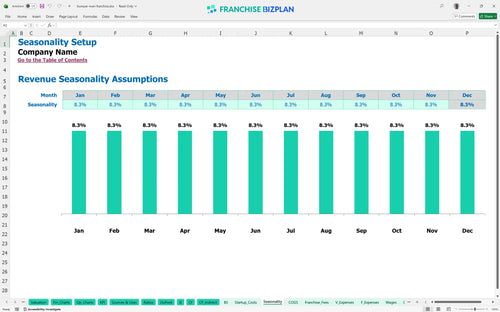
Researched revenue assumptions
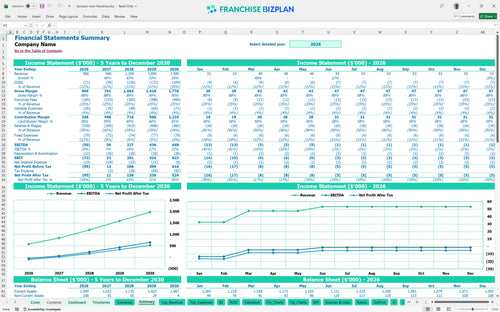
Lender-friendly financial outputs
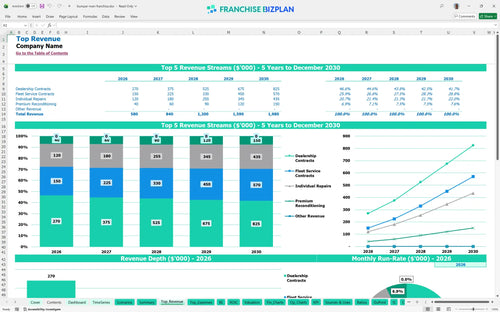
Revenue stream detailed view
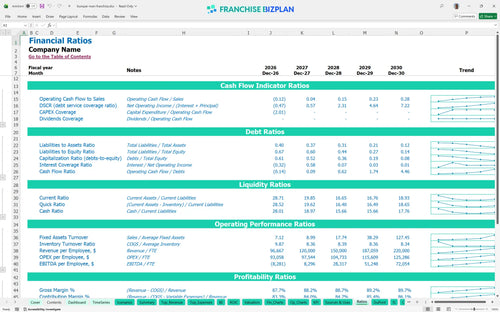
Performance metrics benchmark
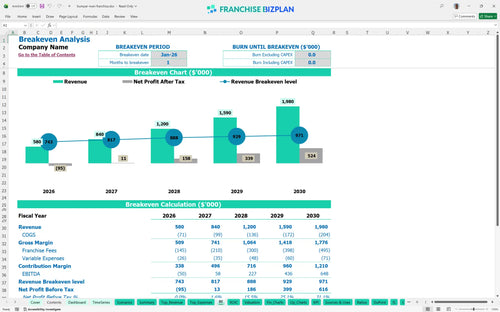
We developed this mobile automotive franchise financial model using detailed market research and real-world operational data. The pre-populated assumptions cover everything from dealership contract revenue to the 25% royalty fee, providing a ready-to-use framework that shows Year 1 revenue reaching $580,000 with a clear path to $1.98M by Year 5.
The unit reaches positive EBITDA in Year 2, generating $58,000 after a small Year 1 loss of $50,000. This franchise unit profitability analysis shows that as revenue scales from dealership and fleet contracts, the net margin expands significantly by Year 3.
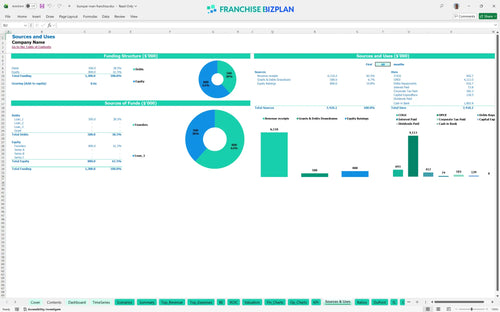
The total mobile bumper repair business startup costs include a $50,000 franchise fee and $128,500 in total capital expenditures. These startup capital requirements cover your first two mobile units, specialized paint systems, and initial branding to ensure you are road-ready from day one.
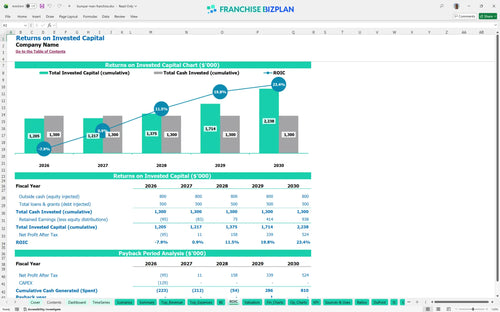
You can expect a 4.52% Internal Rate of Return (IRR) and a 4-year payback period on your initial investment. The model shows a Return on Equity (ROE) of 1.17, reflecting the steady growth of recurring B2B service contracts over a five-year horizon.
The unit hits its monthly break-even point in January 2026, just one month after launch. This rapid break-even is driven by low fixed overhead and the immediate activation of dealership contracts, though the 25% royalty fee remains the largest variable drag on unit economics.
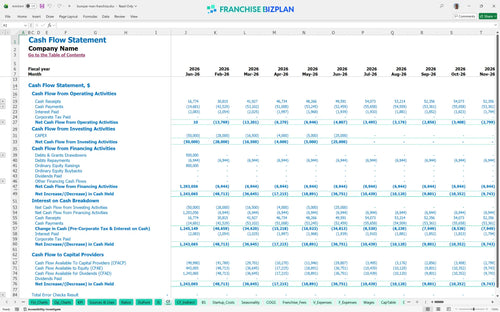
The lowest cash point is projected at $976,000 in December 2027, suggesting a very high initial cash reserve is maintained. You will defintely need to monitor the timing of van acquisitions and the $68,000 manager salary to ensure cash flow remains healthy during the first 18 months of ramp-up.
High-performance scenarios see revenue climbing to $1.98M by Year 5, which significantly offsets the fixed cost of the $68,000 general manager. In contrast, low-volume scenarios make the 25% royalty fee much harder to absorb, highlighting why local marketing and dealership retention are vital for automotive service franchise opportunities.
This franchise financial model template is built in Excel with fully editable assumptions and pre-filled formulas to help you map out your mobile service territory. You can adjust every variable from technician pay to fuel costs, making it simple to adapt the math to your specific market conditions and local labor rates.

Long-term planning is essential for a mobile automotive franchise where scaling involves adding more vans over time. This model provides 5-year projections for revenue, EBITDA, and cash flow, allowing you to see how your margins shift as you move from a single-unit operator to a multi-van fleet.

Understanding the impact of franchise royalty structures is critical for maintaining store-level margins. The model tracks the 25% royalty fee and the initial $50,000 franchise fee, ensuring you see exactly how much cash stays in your pocket after meeting brand obligations and marketing fund contributions.

Knowing how to calculate startup costs for a mobile franchise helps you avoid running out of cash during the ramp-up phase. This tool calculates the total investment needed for vans, equipment, and training, while identifying the exact sales volume required to cover your monthly fixed costs of roughly $5,750.

We have integrated industry-standard benchmarks for mobile service business model performance to help you validate your unit economics. You can compare your projected repair material costs, which start at 10.5%, against typical automotive service franchise opportunities to ensure your pricing strategy is competitive and profitable.


Simply purchase and download the financial model template, then access it instantly using Microsoft Excel or Google Sheets. No installation or technical expertise required-just open and start working.

Enter your business-specific numbers, including revenue projections, costs, and investment details. The pre-built formulas will automatically calculate financial insights, saving you time and effort.

Leverage the investor-ready format to confidently showcase your financial projections to banks, franchise representatives, or investors. Impress stakeholders with clear, data-driven insights and professional reports.

Leverage the investor-ready format to confidently present your projections to banks, franchise representatives, or investors.