
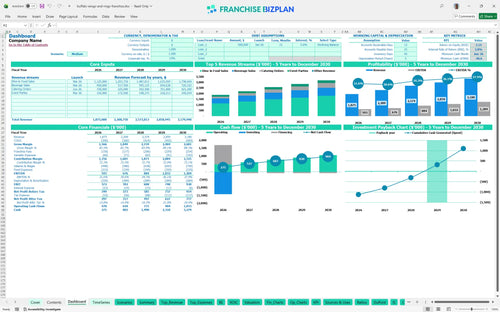
All-in-one Dashboard
Core inputs and core outputs


This franchise unit financial model template provides a complete roadmap from initial investment to five-year maturity, including pro forma financial statements and unit-level economics.
Core inputs and core outputs
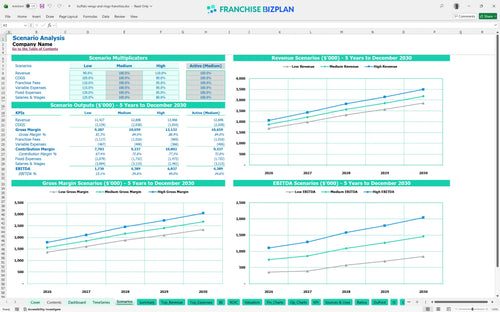
Three scenario analysis
Presentation ready
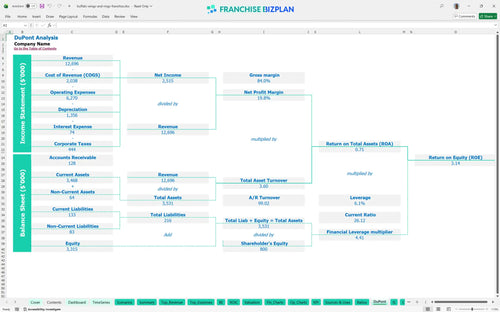
DuPont analysis
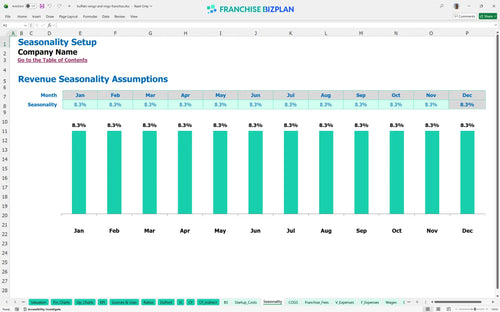
Researched revenue assumptions
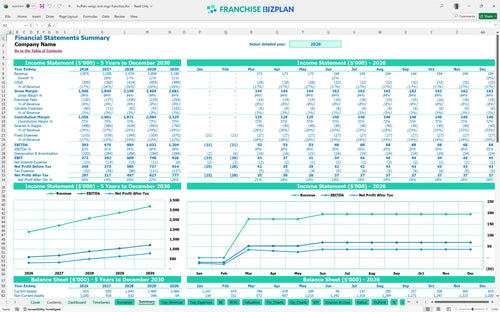
Lender-friendly financial outputs
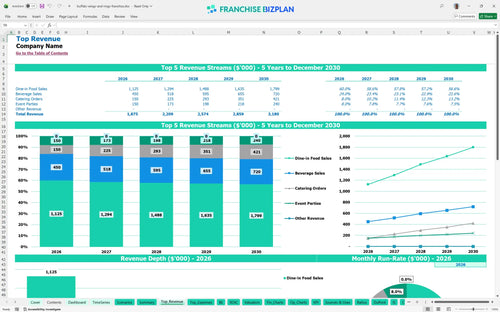
Revenue stream detailed view
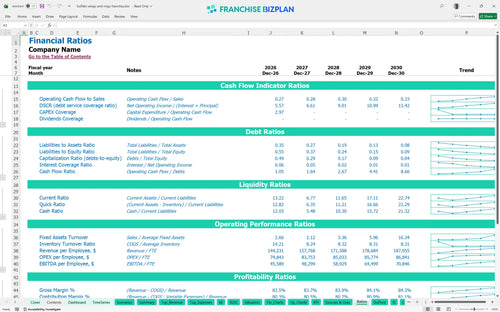
Performance metrics benchmark
We built this franchise unit financial model using our own research to provide a realistic look at the 'club-level' sports bar experience. Key assumptions like the $1.87M year-one revenue and the $1.42M initial build-out are pre-populated and fully editable to fit your specific market. This tool helps you navigate the transition from a business idea to a functional restaurant franchise startup costs estimate.
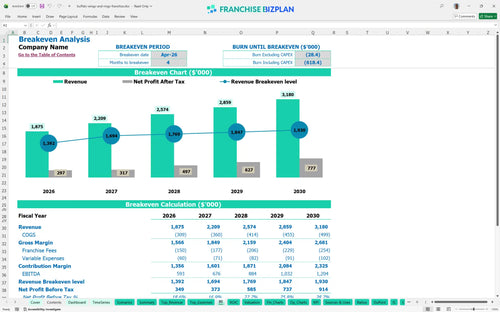
Based on our research, this unit hits its stride early, reaching a break-even analysis point by April 2026, just four months after launching. With year-one EBITDA projected at $593,000, the model shows a clear path to scaling net income as catering and event revenue streams mature over the first 60 months.
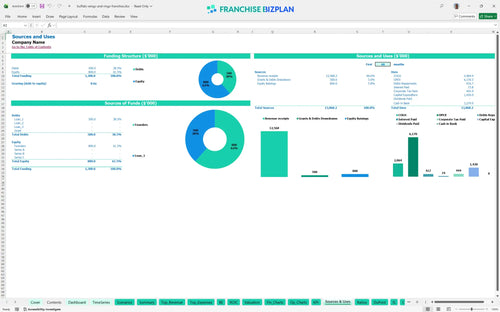
You will need roughly $1.42 million to get this concept off the ground, covering everything from the $40,000 franchise fee to $600,000 in leasehold improvements. The model also accounts for a $49,000 cash dip in June 2026, so having a liquid buffer is defintely required to handle the initial ramp-up phase.
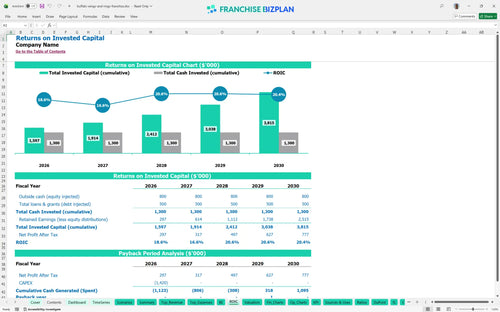
The financial model projects a four-year payback period, which is standard for high-CAPEX restaurant builds in the sports bar segment. While the current IRR sits at 3.77%, the long-term value is found in the steady $1.2M annual EBITDA potential by year five, providing a solid foundation for calculating ROI for restaurant franchise investment.
To cover your fixed costs-led by $18,000 in monthly rent and $80,000 for a General Manager-you need to hit your stride by month four. The biggest revenue driver is dine-in food volume, which accounts for $750,000 of your first-year sales, making throughput and average ticket size the most critical metrics for success.
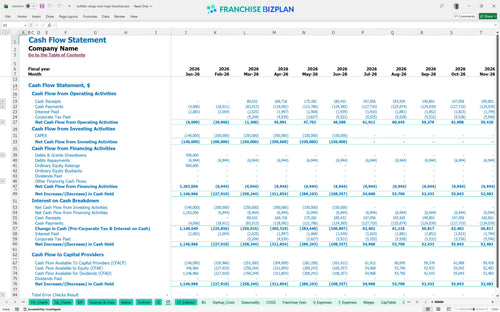
Your lowest cash point occurs in June 2026, showing a $49,000 deficit that must be covered by your initial working capital or a small business franchise financial modeling tools buffer. We recommend a 6-month runway to handle the ramp-up phase before the $1.87M annual revenue fully stabilizes your bank balance and covers ongoing operations.
A 10% drop in revenue can push your payback period out significantly, while the High Case accelerates EBITDA toward that $1.2M year-five mark. The model shows that keeping food ingredients (COGS) at 14% or lower is the primary driver for maintaining year-one margins and ensuring a healthy restaurant franchise unit profit and loss statement.
This restaurant franchise financial model is built in Excel, allowing you to swap every assumption to match your specific territory or real estate deal. You can adjust pre-filled formulas for staffing, local rent, and food costs to see how different scenarios impact your bottom line. It is a living tool designed to adapt as your site selection and build-out costs become more certain.

Planning for a single unit requires looking past the grand opening to see how mature margins evolve over half a decade. This model tracks revenue growth from $1.87M in year one to over $3.1M by year five, helping you map out future cash flow needs for a sports bar franchise business plan. It provides a clear view of the long-term profitability analysis required for multi-unit scaling.

Operating under a brand means paying for the system, and this model bakes in the 5% royalty and 3% marketing fund fees automatically. It ensures you see the net cash available after the franchisor takes their cut of gross sales, making the franchise royalty fee calculation effortless. Understanding these ongoing obligations is critical for maintaining brand standards without sacrificing your store-level margin.

Getting the doors open requires a significant capital expenditure budget, including a $40,000 initial fee and heavy leasehold improvements. This analysis identifies the exact sales volume needed to cover your $18,000 monthly rent and other fixed restaurant operating expenses. We focus on the total startup investment so you know exactly how much liquidity is required before the first wing is served.

We use standard restaurant benchmarks to ensure your labor and food cost assumptions stay within a realistic range for a franchise unit financial template. If your kitchen labor or ingredients drift too high, the model flags the risk to your store-level EBITDA. This sanity check helps you compare your expected performance against typical industry gross margin ranges and occupancy costs.


Simply purchase and download the financial model template, then access it instantly using Microsoft Excel or Google Sheets. No installation or technical expertise required-just open and start working.

Enter your business-specific numbers, including revenue projections, costs, and investment details. The pre-built formulas will automatically calculate financial insights, saving you time and effort.

Leverage the investor-ready format to confidently showcase your financial projections to banks, franchise representatives, or investors. Impress stakeholders with clear, data-driven insights and professional reports.

Leverage the investor-ready format to confidently present your projections to banks, franchise representatives, or investors.