
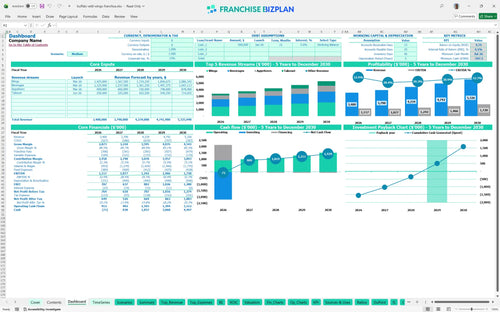
All-in-one Dashboard
Core inputs and core outputs


This template provides a complete financial toolkit for analyzing a sports-themed casual dining unit, featuring dynamic calculators for revenue, labor, and long-term ROI.
Core inputs and core outputs
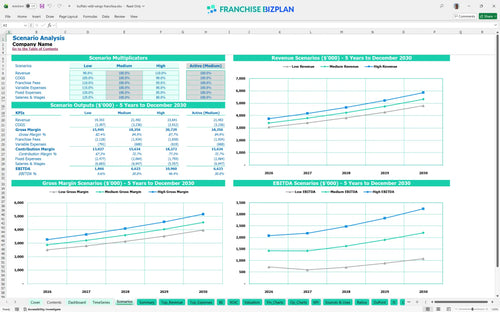
Three scenario analysis
Presentation ready
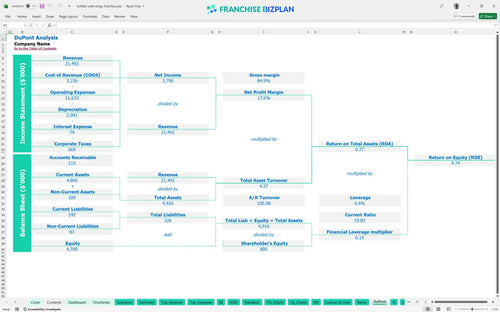
DuPont analysis
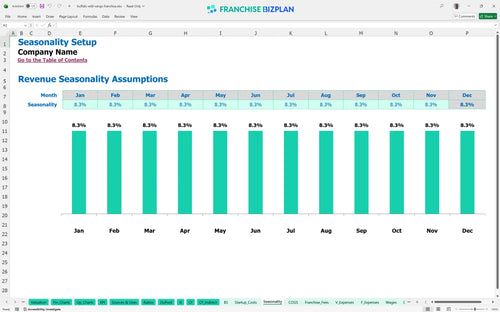
Researched revenue assumptions
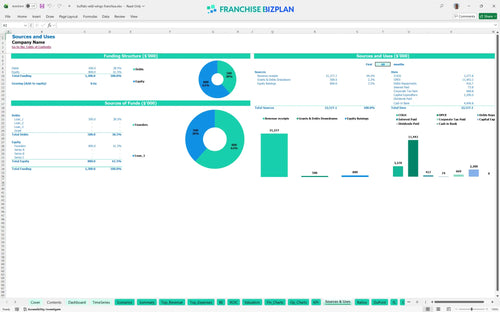
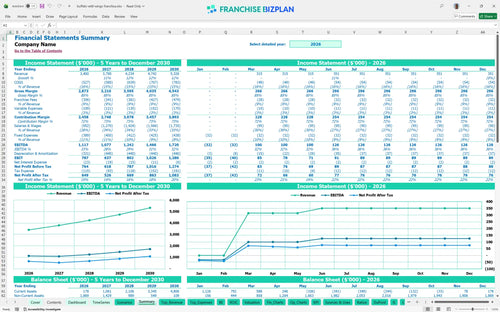
Lender-friendly financial outputs
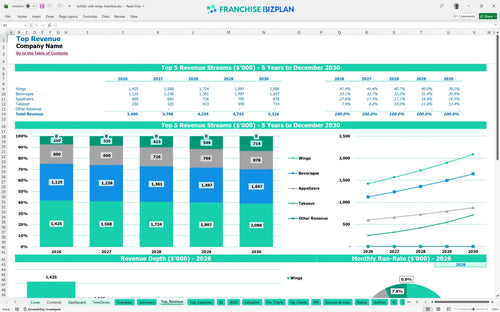
Revenue stream detailed view
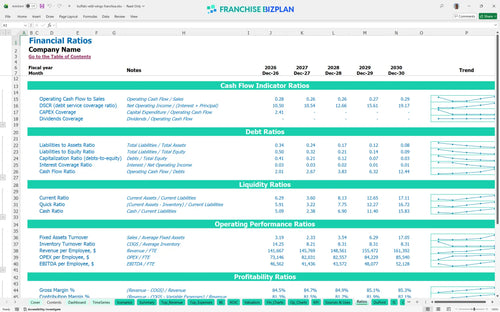
Performance metrics benchmark
We built this financial model using deep-dive research into high-volume sports bar economics. The pre-populated data includes a $3.4M first-year revenue target and detailed staffing for a full-service kitchen and bar, but you can defintely edit everything to match your specific site. It is designed to be a practical tool for owners who need to see how $2.2M in startup capital translates into monthly cash flow.
This unit is projected to hit a positive EBITDA of $1.117M in its first year, showing strong initial demand. While food costs start at 14%, they trend down to 13.2% by year five as you optimize your kitchen operations. The model shows net profit growing steadily as revenue climbs from $3.4M to over $5.3M by the end of the five-year forecast period.
You will need approximately $2.2M in total capital expenditure planning to get the doors open. This covers the $25,000 franchise fee, $800,000 for leasehold improvements, and $450,000 for a high-capacity kitchen. The startup budget spreadsheet for sports-themed restaurant units also accounts for $350,000 in AV technology to ensure you meet the brand's stadium-like atmosphere standards.
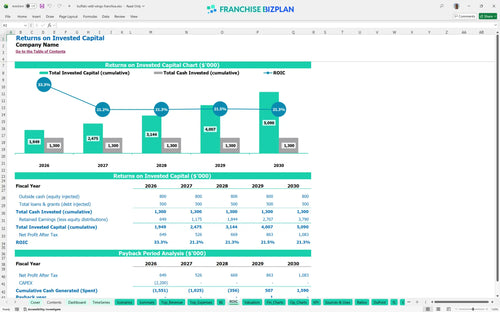
The model projects an Internal Rate of Return (IRR) of 4.06% and a Return on Equity (ROE) of 4.74%. Based on the cash flow from wings, beverages, and takeout, you can expect a 4-year payback period on your initial investment. This restaurant franchise investment return calculator helps you see the long-term value of the equity you are building in the territory.
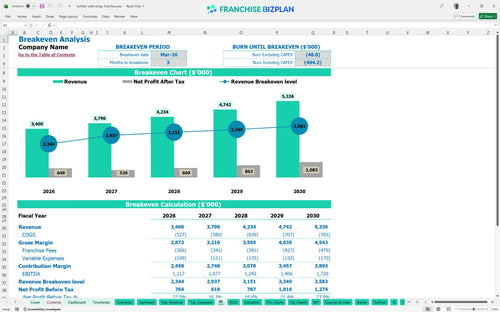
The unit reaches its break-even point in March 2026, just three months after the initial launch. This rapid timeline is driven by high-volume wing sales and a strong beverage mix, but it requires hitting your $3.4M annual revenue target. This restaurant unit economic model for investors shows that managing your $22,000 monthly rent is the biggest hurdle to staying in the black.
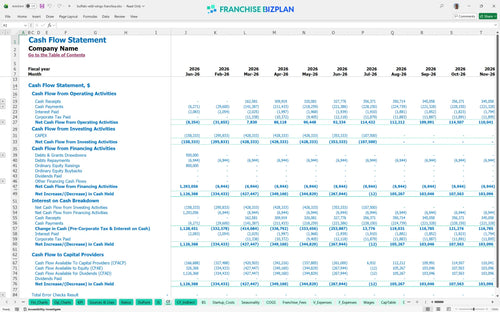
The lowest cash point occurs in July 2026, with a projected deficit of $597,000 during the initial ramp-up. You need enough working capital to bridge the gap between your massive CAPEX spend and the point where monthly operating cash flow forecast for restaurants becomes consistently positive. Having a six-month buffer is highly recommended to handle any construction or permitting delays.
A financial feasibility study for sports bar franchise units must account for volatility in wing prices and labor. In a high-revenue scenario, your year-1 margin expands significantly as you leverage the $22,000 fixed rent against more traffic. Conversely, the franchise restaurant profit and loss statement template shows that a 10% drop in volume can delay your payback period by over 12 months.
This restaurant franchise financial model is built entirely in Excel, giving you total control over every line item. You can swap out the pre-filled research for your own local data, and the editable formulas will instantly update your projections. It is the most flexible Excel template for restaurant franchise startup costs available for serious operators.

Planning for the long haul is easier with detailed pro forma financial statements that span sixty months. This tool provides food service financial forecasting that tracks your growth from the first wing sold to a mature multi-unit operation. Use it as a restaurant business plan template to secure funding or map out your next territory.

Franchise-specific costs can eat your margin if you don't track them right. This model shows you how to calculate royalty fees for franchise financial models by applying a 5% royalty and 4% marketing fund contribution against your gross sales. It ensures you see the exact impact of brand-related costs on your bottom line before you sign the agreement.

Get a clear picture of your total franchise unit startup costs, from the initial fee to the final signage installation. The built-in break-even analysis identifies the exact monthly sales volume needed to cover your $22,000 monthly rent and high-volume labor. Knowing your floor helps you manage the risk of a slow ramp-up period.

Stop guessing if your restaurant operating expenses are in line with the market. We have included benchmarks for estimating labor costs for high volume restaurant franchise units, so you can see if your 10 servers and 5 cooks are within standard ranges. These metrics help you spot margin leaks in your food costs or utility spending before they become problems.


Simply purchase and download the financial model template, then access it instantly using Microsoft Excel or Google Sheets. No installation or technical expertise required-just open and start working.

Enter your business-specific numbers, including revenue projections, costs, and investment details. The pre-built formulas will automatically calculate financial insights, saving you time and effort.

Leverage the investor-ready format to confidently showcase your financial projections to banks, franchise representatives, or investors. Impress stakeholders with clear, data-driven insights and professional reports.

Leverage the investor-ready format to confidently present your projections to banks, franchise representatives, or investors.