


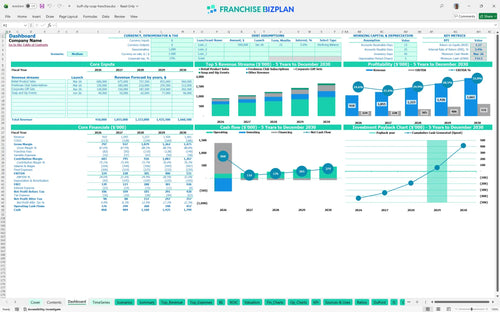
All-in-one Dashboard
Core inputs and core outputs



This financial model template for handmade retail business provides a complete Excel-based toolkit for projecting startup costs, monthly operations, and five-year profitability for a franchise unit.
Core inputs and core outputs
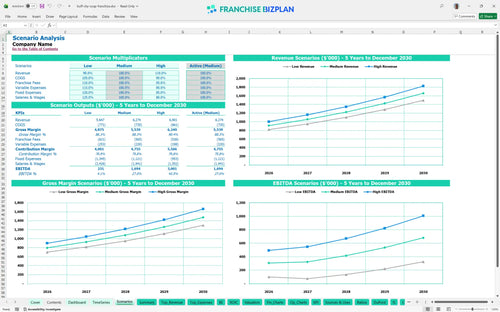
Three scenario analysis
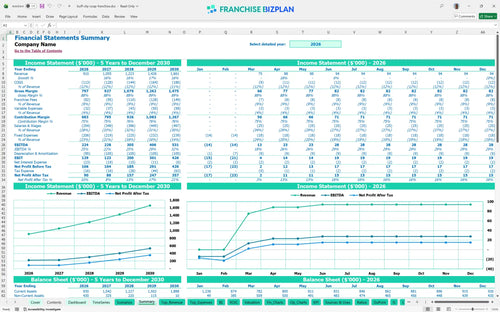
Presentation ready
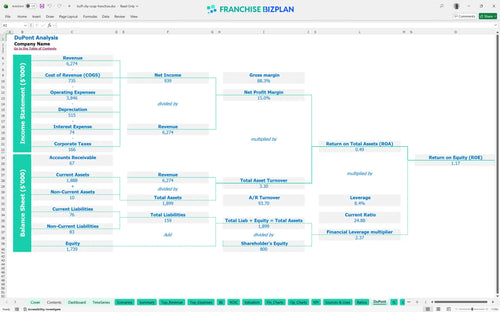
DuPont analysis
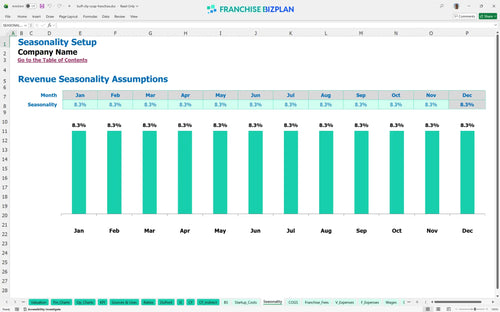
Researched revenue assumptions
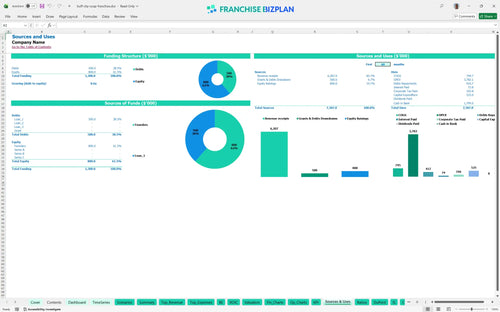
Lender-friendly financial outputs
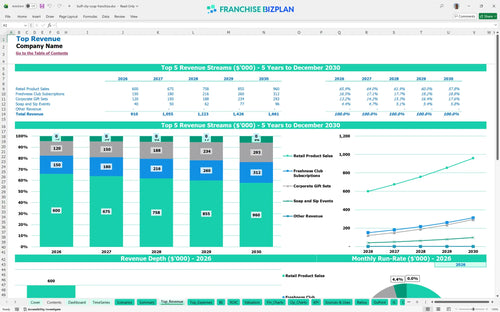
Revenue stream detailed view
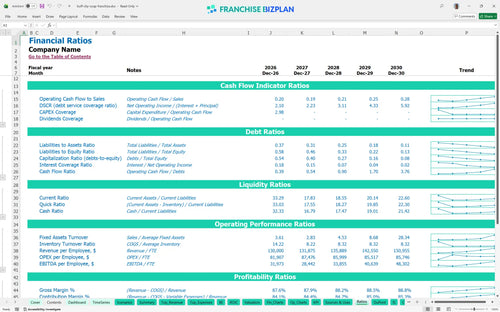
Performance metrics benchmark
We built this franchise unit financial model using our own research into the skincare retail sector. Key assumptions like the $910,000 Year 1 revenue and 6% royalty are pre-populated and fully editable to match your specific territory. This tool helps you see how the $525,000 initial investment translates into long-term cash flow.
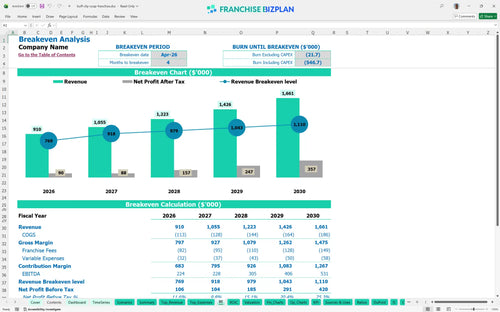
This franchise financial projection spreadsheet for new owners shows the unit hitting breakeven by April 2026, just four months after launching. With Year 1 EBITDA projected at $224,000, the model shows consistent growth as subscription revenue and corporate gift sets scale. Here's the quick math: your margin lives or dies by the artisan labor schedule.
You will need a total initial investment of $525,000 for CAPEX, plus a cash buffer to reach the $732,000 minimum cash point in March 2026. This franchise investment breakdown includes $220,000 for leasehold improvements and $110,000 for maker equipment. Knowing how to calculate startup costs for a retail franchise properly prevents mid-project funding gaps. Your build-out is your biggest hurdle.
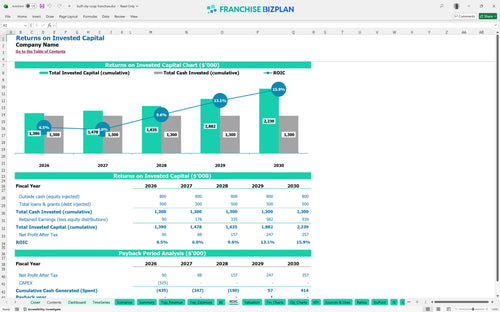
The retail franchise ROI calculator excel projects a 4-year payback period on your total investment. With an Internal Rate of Return (IRR) of 3.42% and a Return on Equity (ROE) of 1.17, this is a steady play rather than a get-rich-quick scheme. By Year 5, you are looking at $531,000 in annual EBITDA, which defintely improves the long-term multiple.
You need to hit your break-even revenue by month four to cover the $12,500 monthly rent and the $239,000 annual base payroll. Estimating monthly operating expenses for a franchise unit is critical because fixed costs don't care about your sales volume. If you can't drive enough foot traffic for the maker experience, the overhead will eat your margins fast. Rent is a fixed beast.
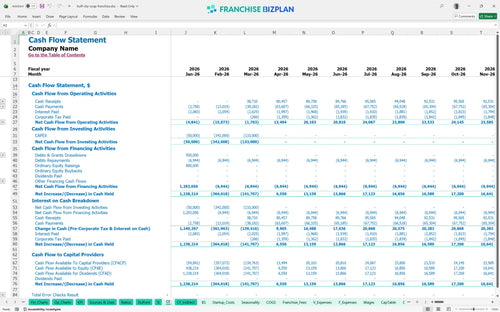
Your lowest cash point is $732,000 in March 2026, right as full operations begin. Preparing a financial forecast for a new franchise location helps you ensure your initial funding covers this valley to avoid a liquidity crunch. Cash is oxygen, and ramp-up is a high-altitude climb that requires a significant opening buffer.
Using the franchise profitability analysis tool, you can see how a 10% drop in retail sales extends your payback period. The excel template for franchise business financial evaluation shows that Year 1 margins are most sensitive to labor productivity and the 12.4% COGS. Scenarios are the difference between a plan and a prayer when market conditions shift.
This franchise financial model template lives in Excel, so you can tweak every line item to fit your specific market. It comes with pre-filled formulas for revenue and costs, but you can change the assumptions as your local lease or labor market shifts. Honestly, a model is only good if it reflects your actual street-level reality. Use the franchise business plan spreadsheet to test different pricing for your handmade soaps and see the impact on your bottom line instantly.

Planning for the long haul means looking past the grand opening. This small business financial projection template maps out five years of growth, from a $910,000 start to over $1.6 million in annual sales. It tracks how scaling your artisan team and Freshness Club subscriptions impacts your cash flow over time. You can visualize the transition from a single-unit startup to a mature, high-volume retail location.

Royalties and brand funds are the franchise tax that never goes away. This tool handles the franchise royalty fee calculation by applying a 6% royalty and 3% marketing fee against your gross sales automatically. Analyzing franchise royalty and marketing fund costs early helps you see exactly how much cash stays in the store. Plus, it tracks the retail store operating expenses like the $12,500 monthly rent to ensure your net margin stays protected.

You need to know when you stop burning cash and start keeping it. This break-even analysis spreadsheet calculates the exact sales volume required to cover your monthly rent and other fixed overhead. Understanding retail franchise startup costs, like the $220,000 for leasehold improvements, is the first step to a real payback plan. You need to know your numbers before you sign a lease.

Don't fly blind when setting your budget. The unit economics model includes benchmarks for labor and COGS, like the 10.8% ingredient cost typical for this handmade retail concept. It helps you verify if your $60,000 manager salary or 1.6% packaging spend is in line with successful operators. Comparing your plan to these standards helps you spot potential margin leaks before they happen.


Simply purchase and download the financial model template, then access it instantly using Microsoft Excel or Google Sheets. No installation or technical expertise required-just open and start working.

Enter your business-specific numbers, including revenue projections, costs, and investment details. The pre-built formulas will automatically calculate financial insights, saving you time and effort.

Leverage the investor-ready format to confidently showcase your financial projections to banks, franchise representatives, or investors. Impress stakeholders with clear, data-driven insights and professional reports.

Leverage the investor-ready format to confidently present your projections to banks, franchise representatives, or investors.