
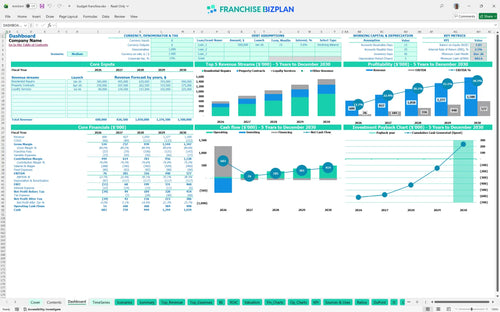
All-in-one Dashboard
Core inputs and core outputs


This Excel template for franchise unit financial planning provides a complete roadmap from your first vehicle purchase to a mature, five-year operating state.
Core inputs and core outputs
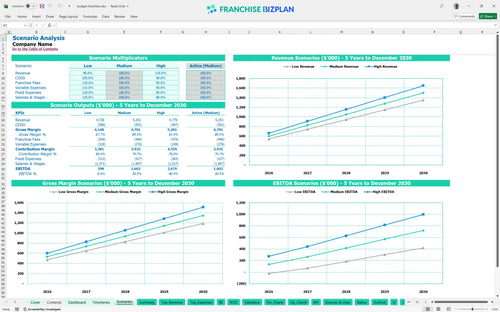
Three scenario analysis
Presentation ready
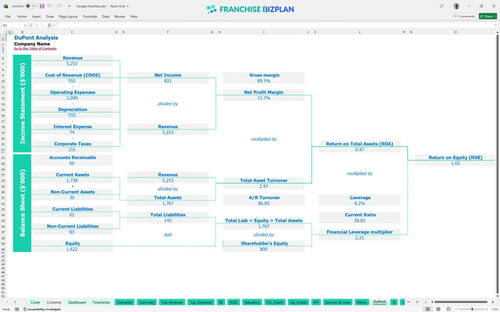
DuPont analysis
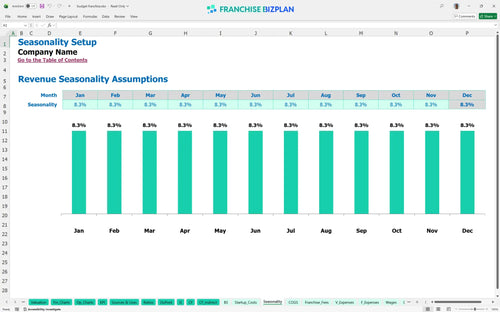
Researched revenue assumptions
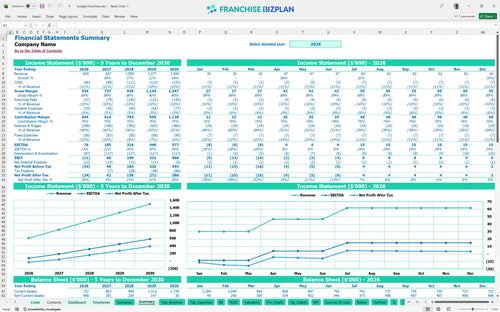
Lender-friendly financial outputs
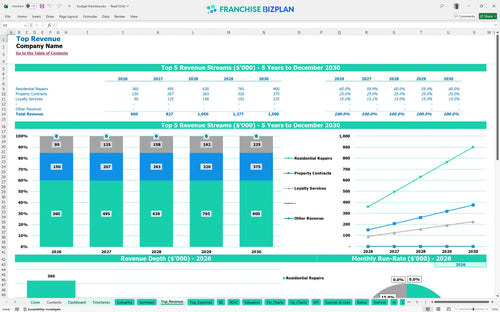
Revenue stream detailed view
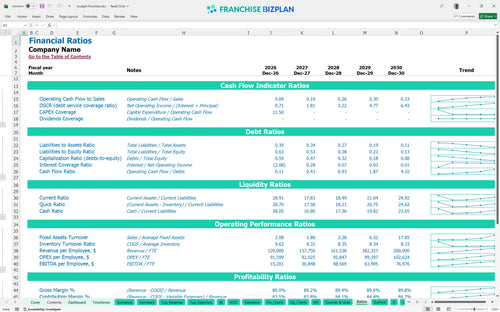
Performance metrics benchmark
We built this franchise business plan financial model using deep research into mobile service unit economics to ensure your projections are grounded in reality. The model comes pre-populated with data for residential repairs and property contracts, showing a Year 1 EBITDA of $76,000 and a path to $577,000 by Year 5. All inputs, from the $50,000 franchise fee to the specific technician headcount, are fully editable to match your local Austin or Mueller district market conditions.
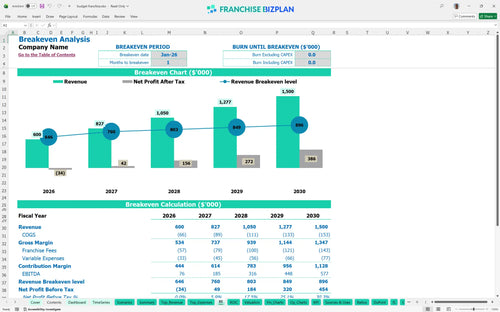
The unit hits positive EBITDA almost immediately, with a break-even date of January 2026. While Year 1 net profit is modest after accounting for the $50,000 franchise fee and $160,000 in vehicles, the model shows EBITDA margins expanding significantly as you scale from 2 to 4.5 field technicians by Year 5. This franchise unit profitability projection spreadsheet defintely shows that scale is the key to moving from a job to a real business.
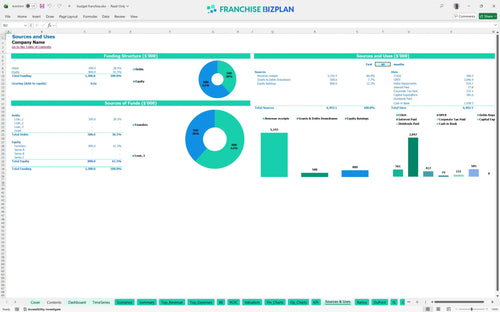
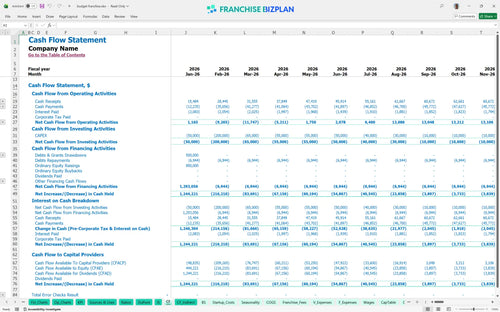
You will need a significant capital stack to launch, with the model showing a minimum cash requirement of $683,000 by late 2026. This covers your initial $50,000 fee, $160,000 for the service fleet, and $100,000 for the office fit-out. Estimating labor and fleet costs for a franchise is critical here, as these represent your largest upfront and ongoing cash drains before the loyalty program revenue kicks in.
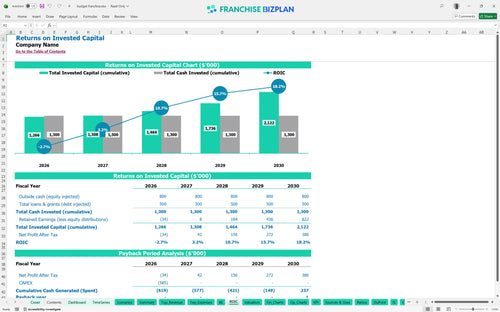
The model projects a 5-year payback period with an Internal Rate of Return (IRR) of 2.49%. While the IRR might look lean initially, the Return on Equity (ROE) of 1.03 and the jump to $577,000 in annual EBITDA by Year 5 suggest strong long-term value. This financial model for mobile service franchises focuses on the build-up of equity in the fleet and the recurring revenue from property contracts.
Break-even occurs in the very first month of operations, provided you hit the $240,000 Year 1 target for residential repairs. The primary driver for staying above break-even is managing the 7.5% royalty and the labor costs for your lead technician and dispatcher. This franchise unit operating budget template shows that even small dips in technician productivity can push your break-even revenue requirement much higher.
The lowest cash point occurs in December 2026 at $683,000, reflecting the heavy upfront CAPEX for vehicles and scheduling software. You need to maintain a solid cash buffer to handle the ramp-up of field technicians, as payroll for a team of five grows quickly. How to forecast revenue for a local franchise accurately is vital so you don't over-hire before the residential repair demand matures.
In a high-growth scenario where you secure more property contracts early, Year 1 EBITDA can beat the $76,000 baseline. However, a low-revenue scenario where Residential Repairs lag will stretch your payback period beyond 5 years. This franchise investment feasibility study template allows you to stress-test your $42,000 technician salaries against different revenue levels to see when margins get squeezed.
Finance: update unit break-even and payback model by Friday. Owner: Franchisee.
This franchise financial model template is built entirely in Excel, giving you total control over the math behind your investment. You can easily tweak pre-filled formulas and editable assumptions to match your specific territory, local rent prices, and actual hiring plans without needing a degree in finance.

Planning a multi-unit rollout or a single-unit territory requires a long-term view of your cash. This franchise investment projection tool delivers a detailed 5-year look at your P&L, cash flow, and balance sheet so you can see how scaling from $600,000 to $1.5 million in annual sales affects your bottom line. Using a franchise P&L statement template helps you spot the difference between paper profits and actual bankable cash.

The model handles the heavy lifting of calculating franchise-specific obligations like the 7.5% royalty and 2% marketing fund contributions. By baking these fixed percentages into your franchise unit economics, you get a realistic view of your store-level margin after the franchisor takes their cut. This is the best way to use a franchise ROI calculator to see if the brand's overhead leaves enough room for your own take-home pay.

Starting a new territory involves more than just the franchise fee; you have to account for vehicles, tools, and office fit-outs. This franchise startup cost spreadsheet helps you map out the total initial investment and identifies the exact sales volume needed to cover your fixed monthly costs like the $3,500 office rent. Knowing how to calculate startup costs for a new franchise properly ensures you don't run out of gas before the customers start calling.

We have integrated researched benchmarks for home service models to help you sanity-check your numbers. Use this for your franchise unit profitability analysis to see if your 9.5% service material cost or your technician wages align with typical industry standards. Analyzing franchise unit overhead costs against these benchmarks helps you identify if you are overspending on fleet insurance or admin supplies compared to top-tier operators.


Simply purchase and download the financial model template, then access it instantly using Microsoft Excel or Google Sheets. No installation or technical expertise required-just open and start working.

Enter your business-specific numbers, including revenue projections, costs, and investment details. The pre-built formulas will automatically calculate financial insights, saving you time and effort.

Leverage the investor-ready format to confidently showcase your financial projections to banks, franchise representatives, or investors. Impress stakeholders with clear, data-driven insights and professional reports.

Leverage the investor-ready format to confidently present your projections to banks, franchise representatives, or investors.