
All-in-one Dashboard
Core inputs and core outputs


This franchise unit financial projection excel template provides a complete toolkit for estimating operating expenses for window covering franchise units, including 5-year P&L, cash flow, and CAPEX tracking.
Core inputs and core outputs
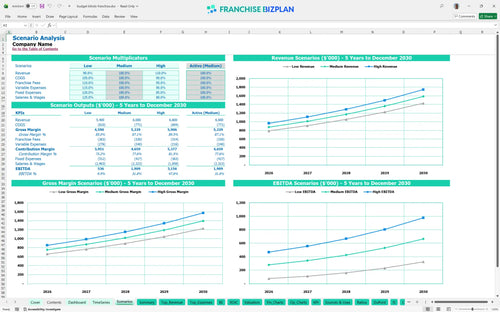
Three scenario analysis
Presentation ready
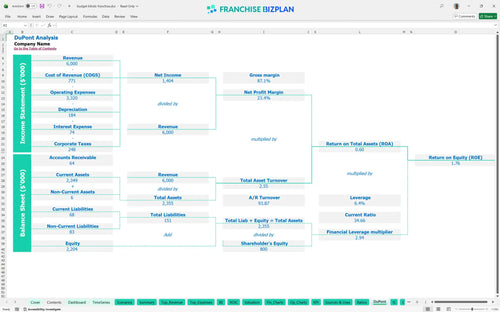
DuPont analysis
Researched revenue assumptions
Lender-friendly financial outputs
Revenue stream detailed view
Performance metrics benchmark
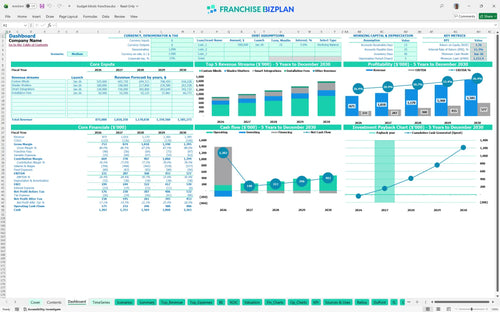
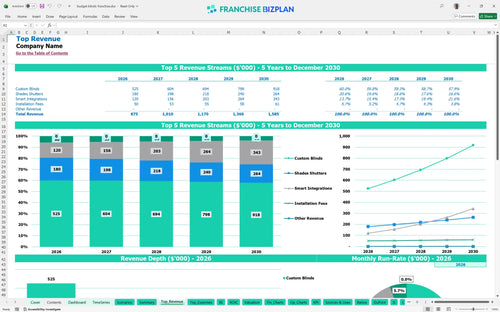
We built this franchise unit financial model using deep-dive research into the window treatment sector to provide a realistic roadmap for new owners. The model comes pre-populated with data for revenue streams like Custom Blinds ($350k Y1) and Smart Integrations ($80k Y1), plus detailed capital expenditure forecasting for your mobile showroom. It is a practical franchise investment feasibility study template that you can tweak as your local market conditions evolve.
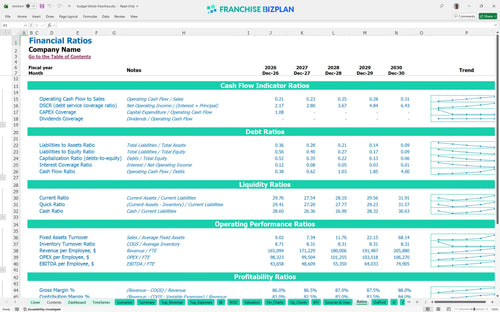
Your franchise unit hits a positive EBITDA of $231,000 in the first year, scaling to $577,000 by year five as you optimize unit economics. This franchise profitability analysis accounts for all brand obligations, ensuring your net gains are realistic after the 3.5% royalty is paid. Staying on top of your material costs, which start at 12%, is the key to protecting your bottom line as you grow.
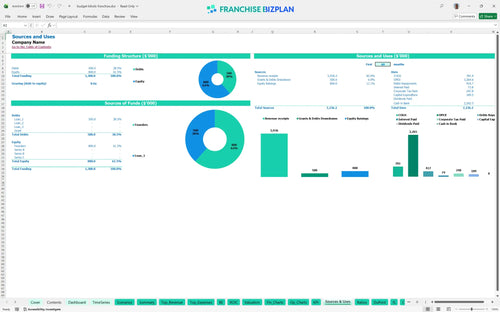
To get this mobile retail operation off the ground, you need a total initial investment of $189,450, covering everything from the franchise fee to your first mobile showroom. This franchise startup cost calculator includes $65,000 for your vehicle and $25,000 for sample inventory to ensure you can sell effectively on day one. Knowing how to calculate startup costs for a home services franchise helps you avoid common liquidity traps during the launch phase.
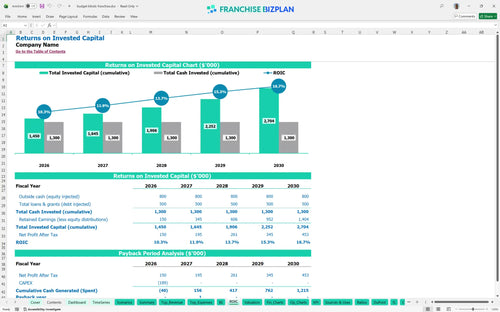
Investors can expect an Internal Rate of Return (IRR) of 11.34% and a Return on Equity (ROE) of 1.76 over the five-year period. This franchise investment ROI spreadsheet indicates a two-year payback period, which is quite competitive for a mobile showroom business model. Analyzing the essential financial metrics for new franchise owners shows that the speed of the ramp-up directly dictates your long-term wealth creation.
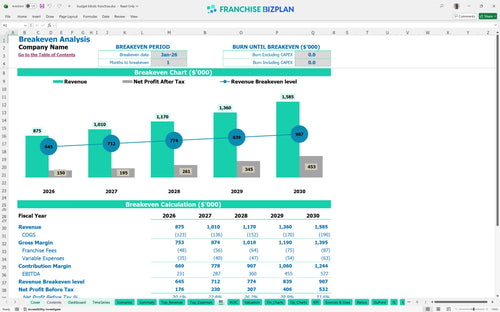
The unit reaches its break-even analysis milestone in January 2026, essentially within the first month of operation. This aggressive timeline depends heavily on your ability to hit the $875,000 year-one revenue target through consistent lead generation and high-ticket sales. Your biggest lever here is managing the fixed expenses like the $2,200 monthly vehicle lease and $78,000 general manager salary.
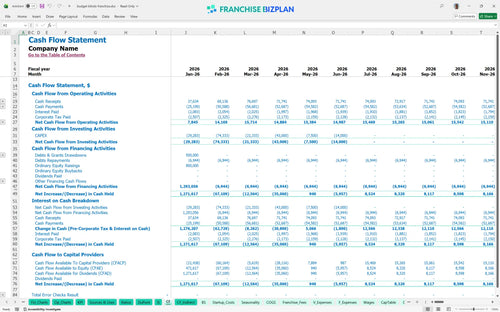
The model shows your lowest cash point occurs in June 2026 at $1,152,000, which suggests a very healthy liquidity position if you start with significant capital. You'll need to defintely track your cash flow forecast for a franchise location to ensure the timing of large equipment purchases doesn't clash with payroll cycles. Even with strong sales, keeping a buffer is smart to handle the timing gaps between installation and final payment.
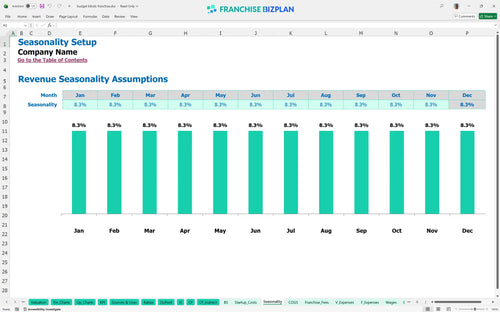
The model allows you to toggle between Low, Medium, and High scenarios to see how a 10% dip in revenue or a spike in material costs affects your year-1 margin. In the High case, increasing your smart home integration sales-which are projected to grow from $80k to $228k-can significantly pull forward your peak proftability. Calculating recurring revenue for home automation services in these scenarios helps you plan for long-term stability regardless of market shifts.
This franchise financial model template is built in Excel, giving you total control over every variable in your window treatment franchise business plan. You can adjust the pre-filled formulas and editable assumptions to match your specific territory, whether you are looking at a single van or a multi-unit expansion. It handles everything from revenue drivers like lead conversion to the nitty-gritty of local operating costs.

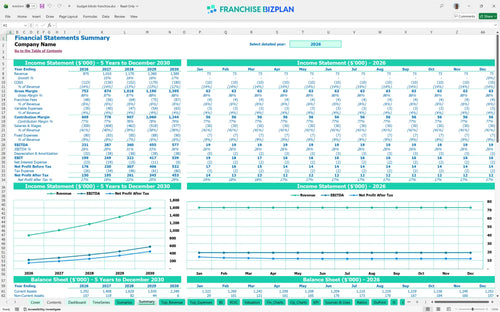
This financial template for mobile retail franchise business operations delivers a detailed five-year outlook on your P&L, balance sheet, and cash flow. By mapping out long-term revenue and cost trends, you can see how scaling your fleet or adding design consultants impacts your bottom line over time. It is designed to help you move past month-to-month survival and into strategic growth planning.

The model accurately captures your ongoing franchise royalty fees and brand marketing fund contributions to show your true store-level margin. With a 3.5% royalty and 2.0% marketing fee baked into the calculations, you can see exactly how much cash stays in your pocket after meeting brand standards. This ensures your projections reflect the real economics of being part of a national network rather than an independent shop.

Planning your launch requires a clear view of total initial investment and the sales volume needed to cover your monthly nut. This tool includes a break-even analysis that factors in your fixed costs, like the $2,200 monthly vehicle lease, and variable expenses to find your safety zone. It helps you estimate the working capital requirements needed to bridge the gap between your first consultation and a steady installation schedule.

We have integrated industry-specific benchmarks to help you sanity-check your planning labor costs for professional installation franchises. By comparing your projected gross margins and occupancy costs against typical ranges for home service models, you can identify if your staffing levels are too heavy or your pricing is too thin. This data-driven approach takes the guesswork out of your first year of operations.


Simply purchase and download the financial model template, then access it instantly using Microsoft Excel or Google Sheets. No installation or technical expertise required-just open and start working.

Enter your business-specific numbers, including revenue projections, costs, and investment details. The pre-built formulas will automatically calculate financial insights, saving you time and effort.

Leverage the investor-ready format to confidently showcase your financial projections to banks, franchise representatives, or investors. Impress stakeholders with clear, data-driven insights and professional reports.

Leverage the investor-ready format to confidently present your projections to banks, franchise representatives, or investors.