
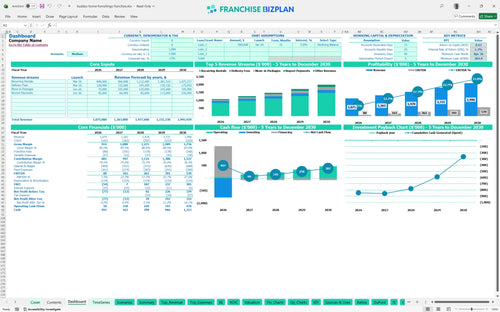
All-in-one Dashboard
Core inputs and core outputs


This franchise unit financial projection template provides a complete pro forma toolkit for analyzing rent-to-own store operating expenses and long-term ROI.
Core inputs and core outputs
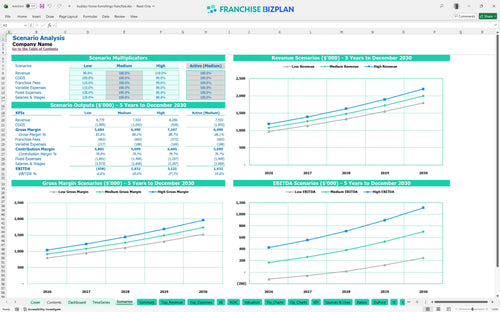
Three scenario analysis
Presentation ready
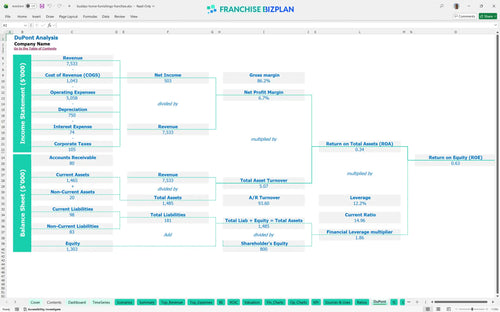
DuPont analysis
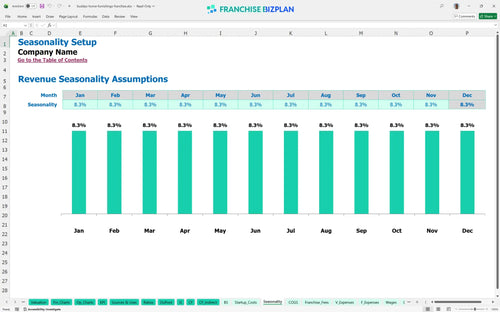
Researched revenue assumptions
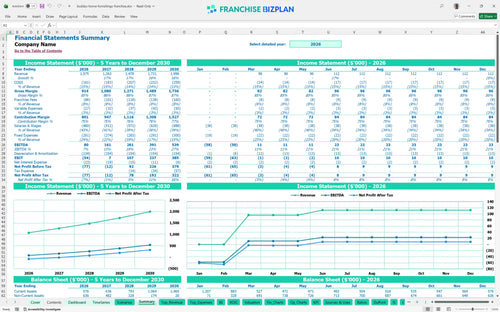
Lender-friendly financial outputs
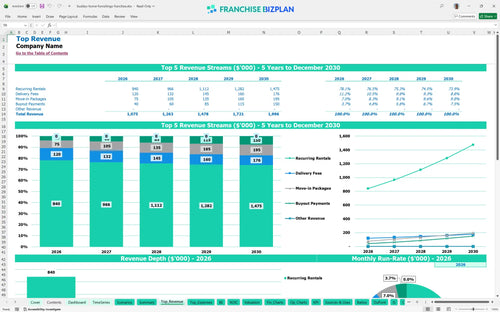
Revenue stream detailed view
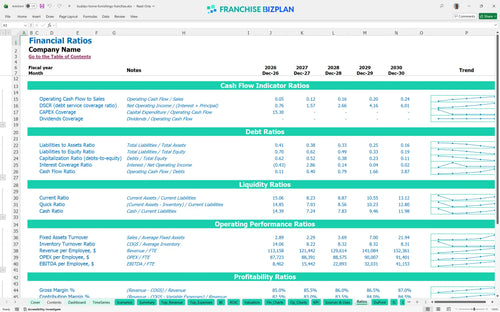
Performance metrics benchmark
We developed this rent-to-own business financial model for excel using deep research into the furniture rental sector to ensure the data is practical and actionable. The assumptions for revenue streams, like the $560,000 in year-one recurring rentals, and capital costs, such as the $300,000 initial inventory, are pre-populated and fully editable to help you understand how to calculate startup costs for a furniture franchise.
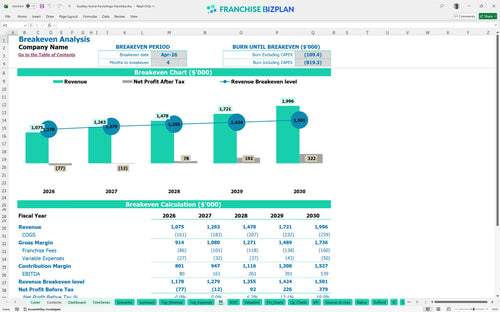
The unit is projected to reach its break-even point in April 2026, just four months after launching operations. By year two, the store generates $161,000 in EBITDA as the recurring rental base matures and merchandise costs stabilize at 13% of total revenue. Speed to break-even is the best hedge against early-stage risk.
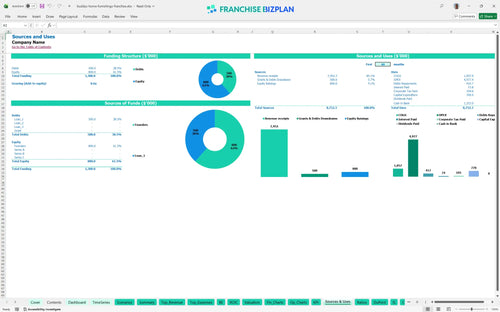
The total initial investment for this unit is approximately $769,900, which covers everything from the $39,900 franchise fee to the $300,000 initial inventory. The largest portion of your capital is allocated to leasehold improvements and the high-quality home goods required to start the rental cycle. Cash is king, but inventory is the engine.
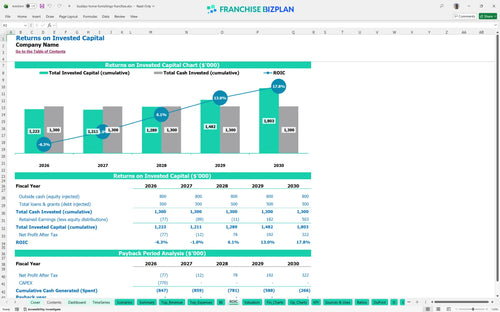
When calculating return on investment for furniture retail stores, this model shows an Internal Rate of Return (IRR) of 1.28% and a Return on Equity (ROE) of 0.63. While full payback of the $769,900 investment occurs after year five, the pro forma financial statements for retail franchise expansion show EBITDA scaling to $539,000 by year five. Patience is a requirement when the payback period crosses the five-year mark.
The monthly break-even point is reached when recurring rentals and buyout payments cover the $16,500 rent and $22,000+ monthly payroll. According to the rent-to-own store inventory turnover financial model, the primary driver for hitting this point by April 2026 is the rapid acquisition of long-term rental contracts. Fixed costs don't care about your sales cycle.
The lowest cash point is projected to be $402,000 in April 2026, meaning you defintely need a significant buffer to handle the ramp-up phase. This cash must cover the $250,000 build-out and the early months of staffing for your 3.5 sales associates before the recurring revenue fully offsets the $16,500 monthly rent. Liquidity is your only safety net during the ramp-up phase.
The franchise financial projection spreadsheet for new owners allows you to test Low, Medium, and High scenarios to see how a 10% shift in rental volume impacts your $80,000 year-one EBITDA. The estimated profitability for retail furniture franchise units improves significantly in the High case if you can maintain the 11.5% merchandise cost target. Execution in the field beats a perfect spreadsheet every time.
Finance: update unit break-even and payback model by Friday
This rent-to-own franchise financial model is built in Excel with fully editable assumptions, allowing you to adjust everything from recurring rental rates to delivery fee structures. You can easily modify the pre-filled formulas to match your specific territory, ensuring the projections reflect your actual lease terms and local labor costs rather than generic industry averages.

Developing a furniture store franchise business plan requires a long-term view of how rental contracts accumulate over time to drive value. This model provides a detailed 5-year outlook, showing EBITDA growing from $80,000 in the first year to $539,000 by year five as your customer base and buyout payments scale up.

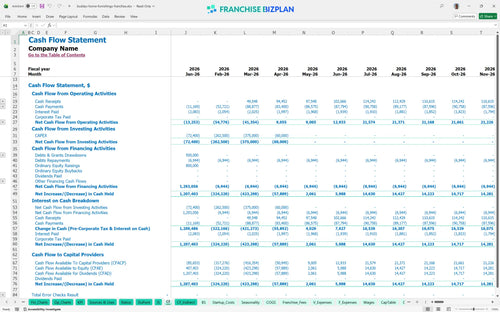
This tool simplifies cash flow forecasting for franchises by automating the calculation of the 6% royalty and 2% marketing fund contributions. It accounts for the initial $39,900 franchise fee and ongoing franchise royalty fee structure, so you can see the exact impact of brand-related costs on your store-level net income.

Our franchise investment calculator helps you estimate the total capital needed for leasehold improvements, signage, and initial inventory. The integrated franchise unit break-even analysis template identifies the specific sales volume and month where your recurring rentals finally cover fixed costs like the $16,500 monthly rent.

This retail franchise startup cost analysis includes researched benchmarks for rent-to-own business model analysis, such as merchandise costs that trend from 13.5% down to 11.5%. These built-in metrics allow you to sanity-check your retail unit economics against typical performance ranges for established furniture retail operators.


Simply purchase and download the financial model template, then access it instantly using Microsoft Excel or Google Sheets. No installation or technical expertise required-just open and start working.

Enter your business-specific numbers, including revenue projections, costs, and investment details. The pre-built formulas will automatically calculate financial insights, saving you time and effort.

Leverage the investor-ready format to confidently showcase your financial projections to banks, franchise representatives, or investors. Impress stakeholders with clear, data-driven insights and professional reports.

Leverage the investor-ready format to confidently present your projections to banks, franchise representatives, or investors.