
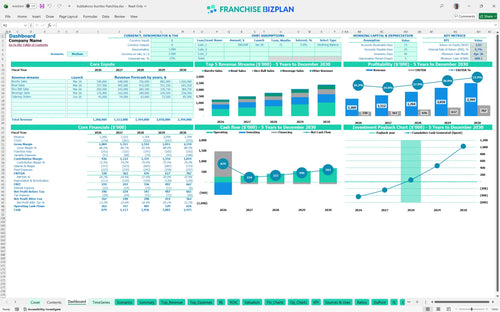
All-in-one Dashboard
Core inputs and core outputs


This franchise business plan Excel includes a complete restaurant franchise operating budget spreadsheet with pre-filled research data for a high-volume fusion restaurant concept.
Core inputs and core outputs
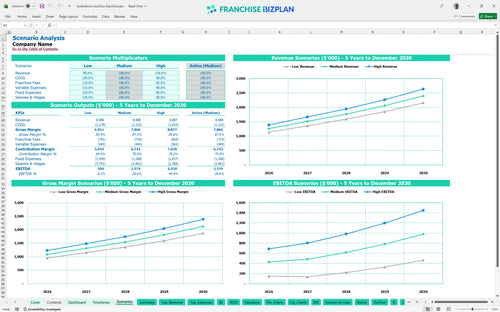
Three scenario analysis
Presentation ready
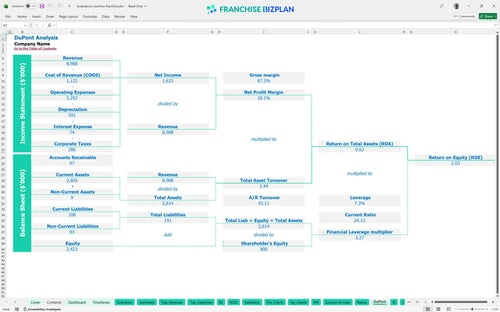
DuPont analysis
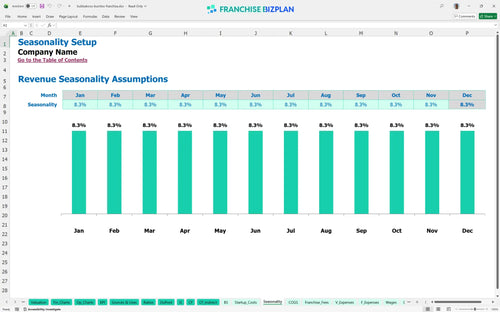
Researched revenue assumptions
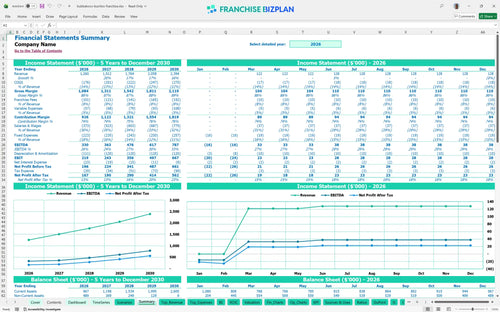
Lender-friendly financial outputs
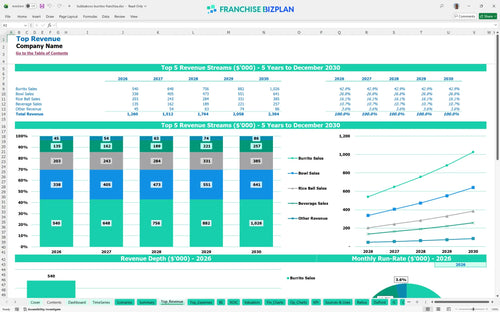
Revenue stream detailed view
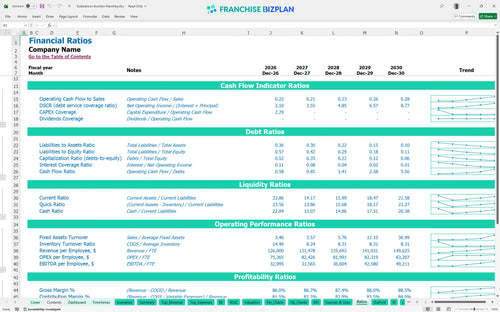
Performance metrics benchmark
We built this franchise unit financial model using our own research on high-volume fusion concepts. Key assumptions like the $330,000 year-one EBITDA and 3-month break-even period are pre-populated with researched data and are fully editable to fit your specific campus-based site.
Based on the $1.26M year-one revenue, this unit hits break-even by March 2026, just three months after launch. Net profit scales as food costs drop from 11.5% to 9% over five years, significantly improving your EBITDA projection.
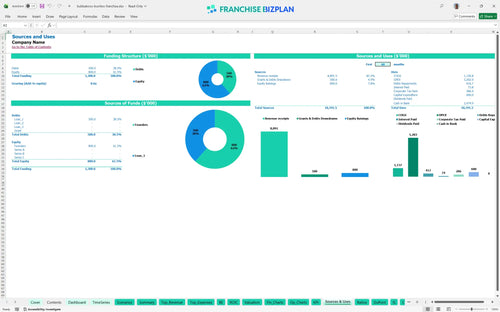
You need approximately $600,000 to get the doors open, covering everything from the $35,000 fee to $130,000 in kitchen equipment. This startup cost breakdown for a campus-based restaurant ensures you aren't undercapitalized during the build-out phase.
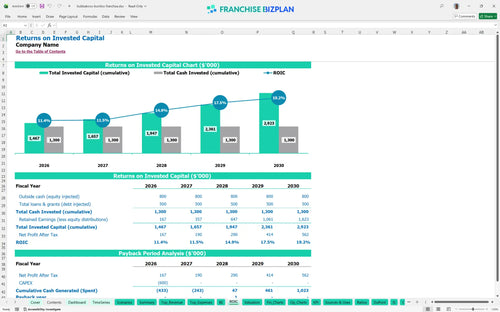
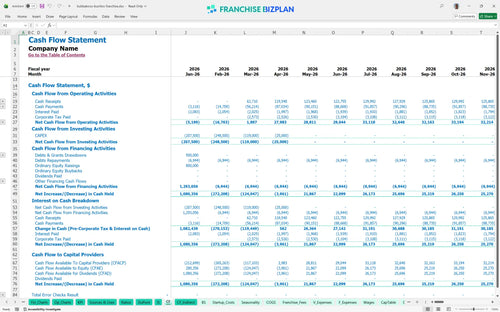
How to build a cash flow forecast for a restaurant depends on realistic returns; this model shows a 3-year payback period and an IRR of 4.69%. While the IRR is steady, the cash flow grows significantly by year five, reaching $787,000 in annual EBITDA.
The unit reaches break-even in month 3, requiring enough volume to cover the $14,000 monthly rent and $19,000+ in monthly management and supervisor salaries. High-volume burrito and rice ball sales are the primary drivers for this fast-casual restaurant startup costs model.
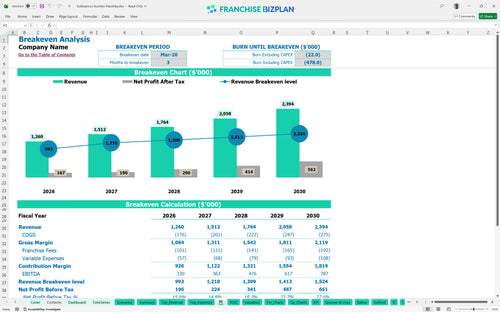
The lowest cash point hits in April 2026 at $680,000, which includes your initial investment and early operating losses. You defintely need a buffer to handle the gap between the January franchise fee payment and the March opening during the ramp-up phase.
Analyzing profitability for a late-night food franchise requires looking at volume swings; a High scenario with better student retention could push Year 1 sales past $1.26M. Evaluating franchise investment opportunities with Excel lets you stress-test how a 10% labor spike impacts your bottom line.
Finance: update unit break-even and payback model by Friday.
This franchise financial model template is built in Excel with editable assumptions for your specific territory. You can adjust the $14,000 monthly rent or local labor rates to see how they impact your store-level margin and overall restaurant profitability analysis.

Plan your multi-unit growth or single-store exit with detailed 5-year revenue and EBITDA projection data. The model tracks growth from $1.26M in year one to $2.39M by year five, helping you map out long-term cash flow and estimating ROI for a new franchise location.

Managing the 6% royalty and 2% marketing fund is critical for maintaining a healthy franchise unit financial projections template. This tool automates these calculations against your gross sales so you know exactly what stays in your pocket after the brand takes its cut.

Use this franchise investment calculator to total your $600,000 initial investment, including the $35,000 franchise fee and $320,000 in leasehold improvements. Knowing your break-even analysis helps you manage the first few months of trading and understand how to calculate startup costs for a fast-casual franchise.

We include unit economics benchmarks for fast-casual labor and food costs. Compare your 11.5% food ingredient cost against industry standards to ensure your kitchen is running lean and profitable, making this one of the best financial planning tools for franchise entrepreneurs.


Simply purchase and download the financial model template, then access it instantly using Microsoft Excel or Google Sheets. No installation or technical expertise required-just open and start working.

Enter your business-specific numbers, including revenue projections, costs, and investment details. The pre-built formulas will automatically calculate financial insights, saving you time and effort.

Leverage the investor-ready format to confidently showcase your financial projections to banks, franchise representatives, or investors. Impress stakeholders with clear, data-driven insights and professional reports.

Leverage the investor-ready format to confidently present your projections to banks, franchise representatives, or investors.