
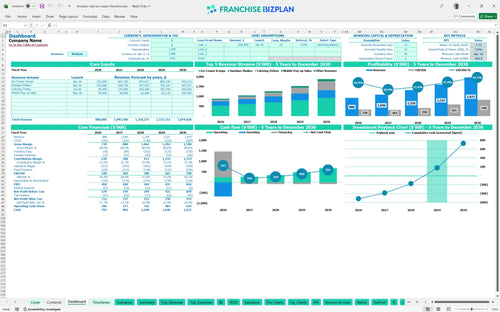
All-in-one Dashboard
Core inputs and core outputs


This comprehensive financial model for retail food franchise unit provides everything you need to forecast cash flow, evaluate ROI, and secure financing for your new location.
Core inputs and core outputs
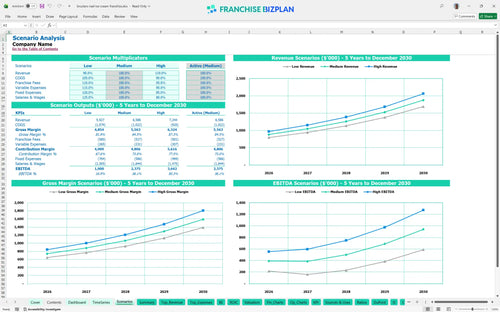
Three scenario analysis
Presentation ready
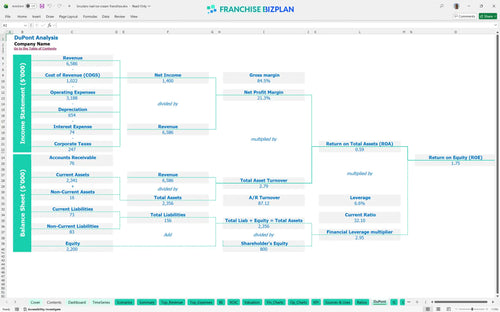
DuPont analysis
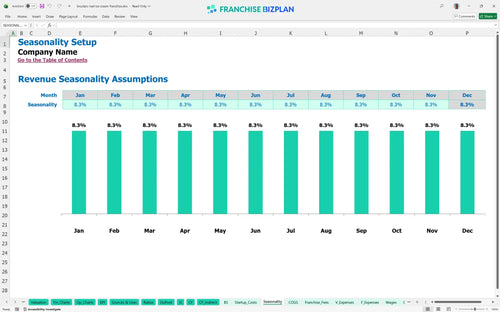
Researched revenue assumptions
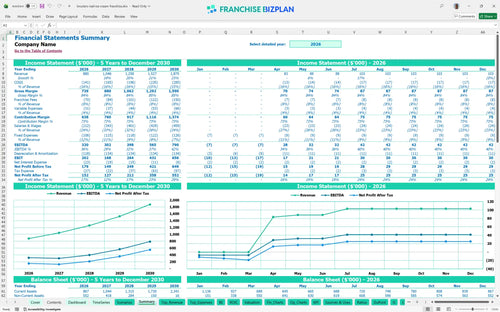
Lender-friendly financial outputs
Revenue stream detailed view
Performance metrics benchmark
We built this franchise unit financial model using our own research on premium dessert concepts, pre-populating it with data like the $40,000 franchise fee and $120,000 production equipment costs. All assumptions, from the $880,000 Year 1 revenue to the 5% royalty and 3% marketing fund, are fully editable to match your specific territory and local labor rates.
The unit hits its stride quickly, reaching break-even by April 2026, just four months after the January start. While Year 1 EBITDA is a healthy $320,000, true profitability depends on managing the 14.5% food cost and the ramp-up of catering orders, which are projected to hit $60,000 in the first partial year.
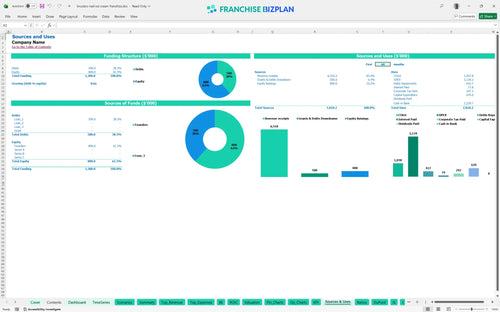
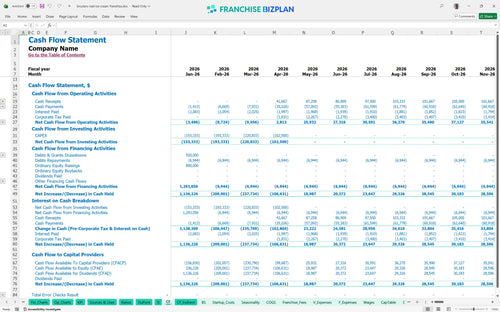
You will need approximately $670,000 to get the doors open, covering everything from the $40,000 initial fee to the $45,000 mobile pop-up vehicle. Most of your capital goes into the $250,000 leasehold improvements and $120,000 in specialized ice cream production equipment.
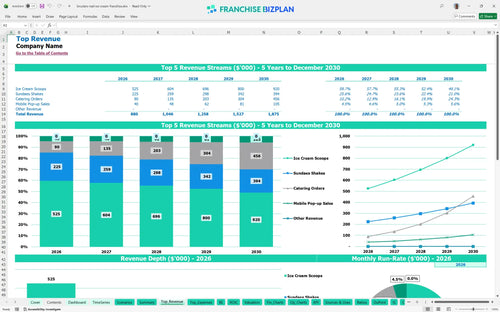
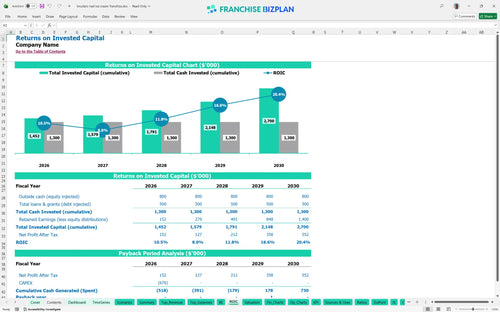
The model shows an Internal Rate of Return (IRR) of 3.79% and a Return on Equity (ROE) of 1.75 over the five-year period. With a 4-year payback period, this is a long-term play that relies on the steady climb of revenue from $880,000 to $1.87M to drive investor value.
Break-even occurs in April 2026, driven primarily by the volume of ice cream scoops and sundaes sold at the walk-up window. To hit this point faster, you must manage the $11,000 monthly fixed costs and ensure labor doesn't exceed the planned 3.5 crew members during the initial ramp.
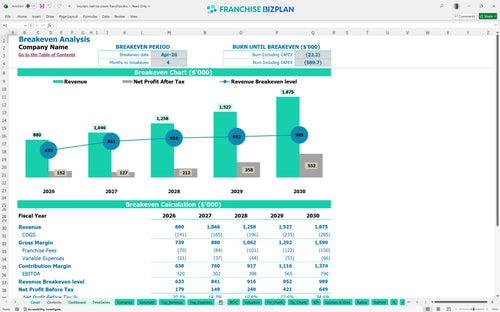
Your lowest cash point is $583,000 in April 2026, which is why having a solid capital cushion is vital. If construction delays push your opening past April, you'll defintely need extra working capital to cover the $6,000 monthly rent and $1,300 in insurance and utilities.
High-performance scenarios assume you hit the $303,750 catering target by Year 5, which significantly boosts the 3.79% IRR. Low scenarios, where revenue lags by 15%, could push the 4-year payback out further, making local marketing execution and school fundraising partnerships critical.
Finance: update unit break-even and payback model by Friday
This ice cream franchise financial model is built in Excel, allowing you to swap out every assumption to fit your specific market. It functions as a franchise startup cost calculator where you can adjust scoop pricing or catering volume to see the immediate impact on your bottom line.

Use this retail franchise business plan template to map out five years of growth, from your first walk-up window to a fleet of mobile units. The franchise profitability analysis Excel provides a clear view of how Year 1 revenue of $880,000 scales to $1.87M by Year 5.

Managing franchise royalty fees and marketing fund contributions is automated within the spreadsheet logic. At a 5% royalty and 3% brand fee, the model ensures you account for every dollar owed to the franchisor before calculating your take-home pay.

This startup budget spreadsheet for retail franchise locations includes a detailed breakdown of your $670,000 initial investment. It calculates the break-even point for food service franchises, showing you exactly when your monthly scoop sales cover the $6,000 rent and $11,000 monthly payroll.

We've integrated operational cost management benchmarks so you can compare your 14.5% food cost against industry standards. This ROI analysis helps you determine if your $250,000 leasehold improvement budget aligns with typical dessert shop performance.


Simply purchase and download the financial model template, then access it instantly using Microsoft Excel or Google Sheets. No installation or technical expertise required-just open and start working.

Enter your business-specific numbers, including revenue projections, costs, and investment details. The pre-built formulas will automatically calculate financial insights, saving you time and effort.

Leverage the investor-ready format to confidently showcase your financial projections to banks, franchise representatives, or investors. Impress stakeholders with clear, data-driven insights and professional reports.

Leverage the investor-ready format to confidently present your projections to banks, franchise representatives, or investors.