
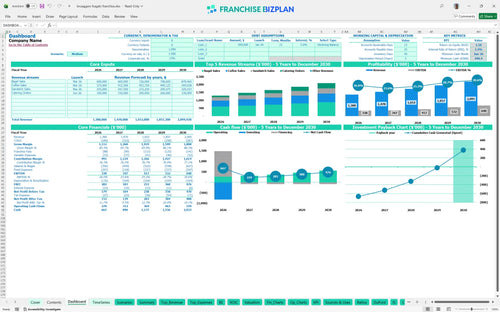
All-in-one Dashboard
Core inputs and core outputs


This franchise unit financial model template provides a data-driven roadmap for estimating startup costs, projecting five-year cash flows, and analyzing unit-level profitability.
Core inputs and core outputs
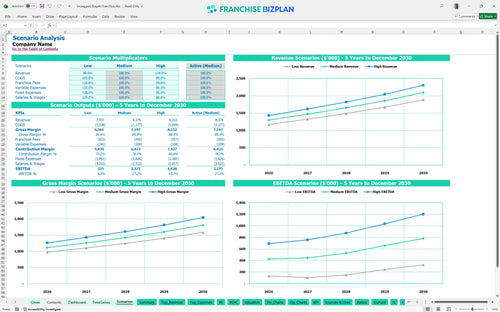
Three scenario analysis
Presentation ready
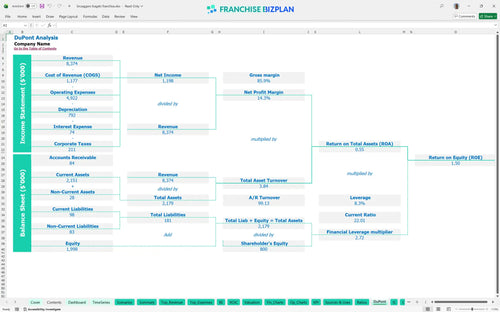
DuPont analysis
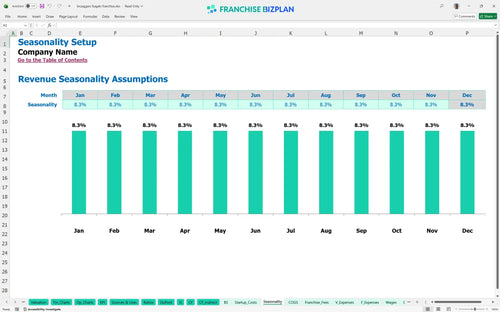
Researched revenue assumptions
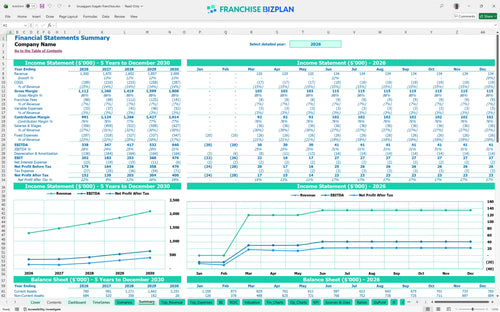
Lender-friendly financial outputs
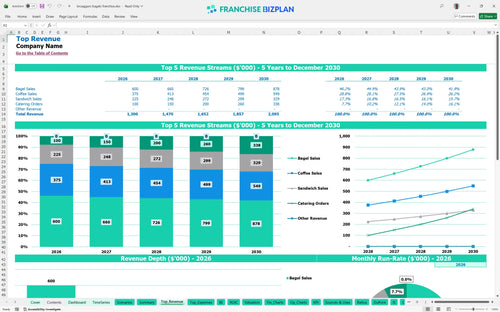
Revenue stream detailed view
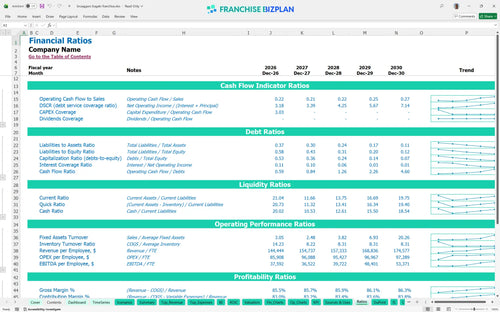
Performance metrics benchmark
We built this franchise unit financial model using detailed research on the bagel industry and specific brand standards. Key assumptions like the $1.3M year-one revenue target and 5% royalty fees are pre-populated and fully editable to match your specific site. This tool ensures your restaurant franchise financial model template Excel is defintely accurate for your local market.
Your unit is projected to reach profitability in its first year, with EBITDA starting at $338,000 and climbing to $640,000 by year five. This assumes you manage the 12% food cost and 1.75% marketing fee while scaling catering to $338,000 annually. Bagel shop business plan and financial projections show that volume is the ultimate margin protector.
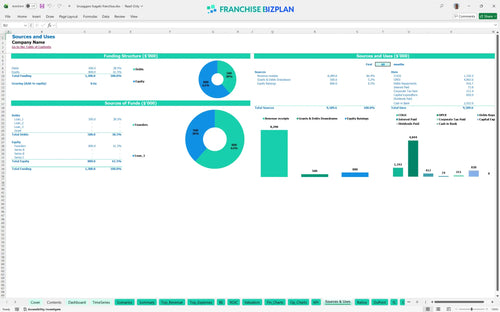
You will need approximately $820,000 in total capital to cover the $35,000 franchise fee and significant equipment costs like the $120,000 ovens. The small business franchise startup budget template accounts for a $490,000 minimum cash requirement to handle the ramp-up period before the April 2026 break-even point. Capital expenditure hits hard before the first bagel is sold.
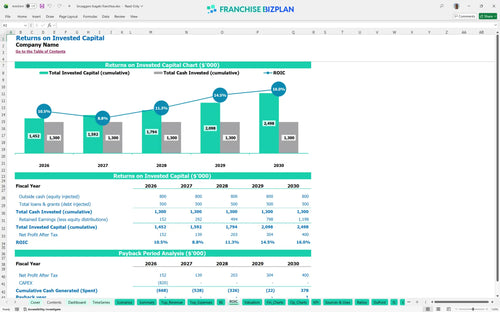
The franchise investment return analysis shows an IRR of 3.18% and a 5-year payback period based on the $820,000 initial outlay. While the ROE sits at 1.5, the steady climb in annual revenue to over $2M by year five provides a stable foundation for long-term equity growth. Unit economics matter more than headline sales for actual ROI calculation.
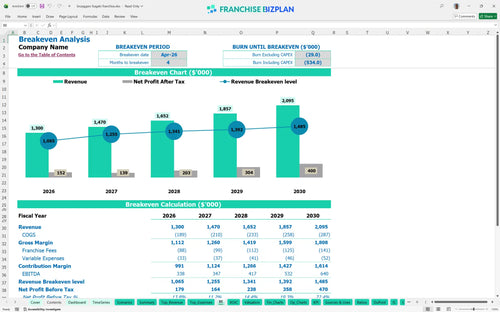
You hit the monthly break-even point in April 2026, just four months after launching operations. The primary driver for this is maintaining a high average ticket through sandwich sales while keeping fixed costs like the $18,000 rent and $2,800 utilities in check. Financial forecasting for new franchise location requires a clear view of your daily sales floor.
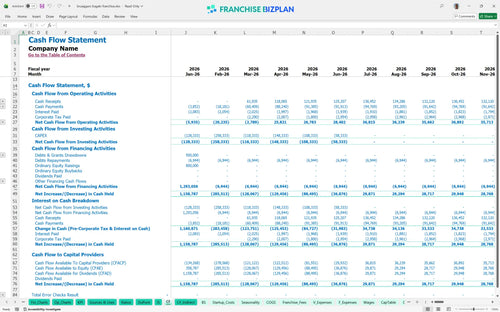
The lowest cash point occurs in June 2026 at $490,000, requiring a solid working capital buffer during the initial ramp-up. You need to manage the timing between your $350,000 build-out payments and the start of catering revenue in June to avoid liquidity crunches. Estimating restaurant operating expenses for franchise helps you avoid mid-year cash surprises.
Small shifts in bagel volume or food costs drastically change your year-one $338,000 EBITDA. High-performing units focus on local marketing to drive commuter traffic, while low-performing ones often struggle with the $110,000+ monthly fixed overhead. Your restaurant profit and loss statement template for franchises should always include a downside case.
Finance: update unit break-even and payback model by Friday
This franchise unit financial model template is fully customizable in Excel, featuring pre-filled formulas and editable assumptions. You can easily adjust variables for your specific territory, local labor rates, and lease terms to see how different scenarios impact your bottom line. Every 1-point margin leak matters fast in a single-unit model.

Map out your path from grand opening to a mature operation with detailed 5-year revenue and cash flow projections. The model tracks how scaling catering orders and increasing bagel throughput drives your restaurant profitability analysis over time. Long-term success depends on consistent traffic and tight waste control.

Account for every dollar owed to the franchisor, including the initial $35,000 fee and ongoing 5% royalty payments. By modeling the 1.75% marketing fund contribution alongside local ad spend, you get a realistic view of your franchise unit economic model. Royalties are a top-line hit that you must manage through volume.

Use this franchise startup costs spreadsheet to estimate your total initial investment, including $350,000 for leasehold improvements and $120,000 for stone hearth ovens. The break-even analysis for quick service restaurant helps you find the exact sales volume needed to cover your $18,000 monthly rent. Knowing your floor is the only way to sleep at night.

Compare your projected labor costs and food margins against established industry standards to ensure your restaurant business plan template is grounded in reality. This helps you spot if your $32,000 crew member salaries or 12% food costs are out of alignment with typical bagel shop operating expenses. Benchmarks keep your assumptions from drifting into fantasy.


Simply purchase and download the financial model template, then access it instantly using Microsoft Excel or Google Sheets. No installation or technical expertise required-just open and start working.

Enter your business-specific numbers, including revenue projections, costs, and investment details. The pre-built formulas will automatically calculate financial insights, saving you time and effort.

Leverage the investor-ready format to confidently showcase your financial projections to banks, franchise representatives, or investors. Impress stakeholders with clear, data-driven insights and professional reports.

Leverage the investor-ready format to confidently present your projections to banks, franchise representatives, or investors.