


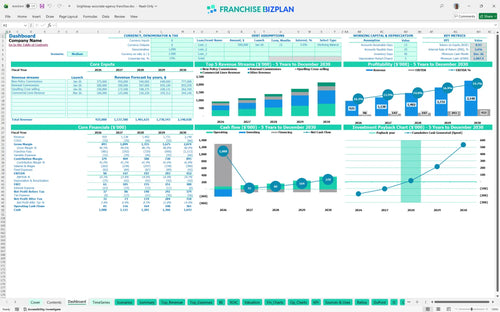
All-in-one Dashboard
Core inputs and core outputs



This franchise unit financial model template provides a comprehensive toolkit for projecting revenue, calculating startup costs, and analyzing the long-term profitability of a retail insurance location.
Core inputs and core outputs
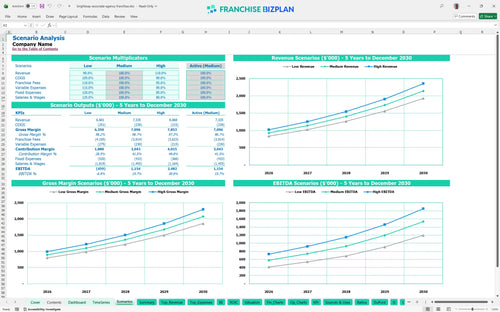
Three scenario analysis
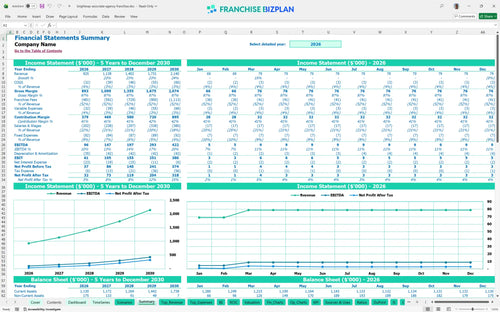
Presentation ready
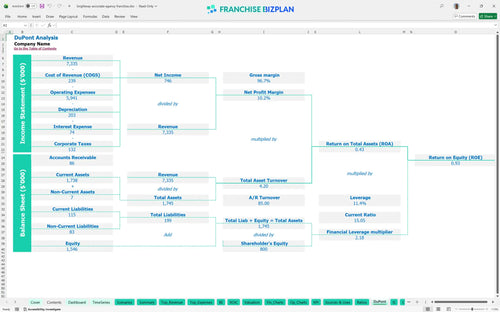
DuPont analysis
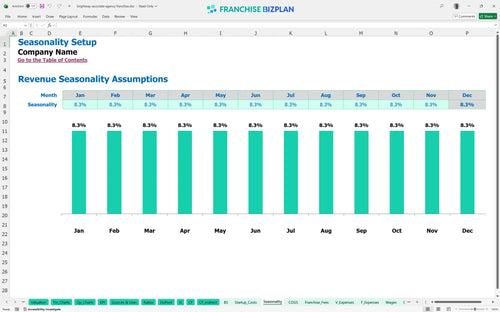
Researched revenue assumptions
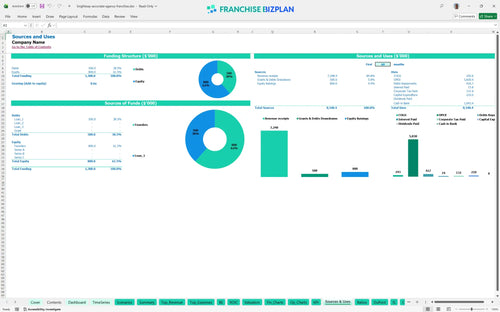
Lender-friendly financial outputs
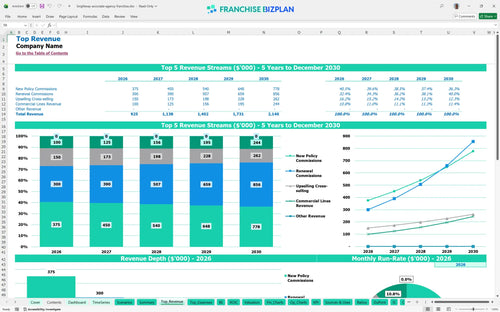
Revenue stream detailed view
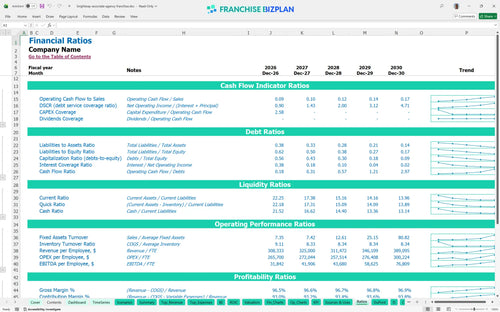
Performance metrics benchmark
We built this insurance agency business plan template based on deep research into the retail insurance sector and specific franchise disclosure data. The model comes pre-populated with realistic revenue streams like new policy commissions and renewals, alongside fixed costs like $5,000 for prime rent and a $90,000 principal salary. With a projected Year 1 EBITDA (earnings before interest, taxes, depreciation, and amortization) of $96,000, this tool gives you a data-driven starting point that you can defintely customize to your local market.
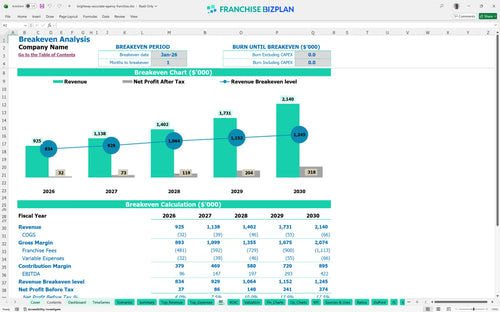
The unit reaches profitability almost immediately, with a break-even date of January 2026, just one month after launch. This rapid turn is driven by the immediate generation of new policy commissions and upselling revenue, which total $925,000 in the first year. Even with a 50% royalty split, the model shows a positive Year 1 EBITDA of $96,000.
You will need approximately $210,000 in initial capital to cover the core setup, plus a significant cash buffer for operations. The primary uses of funds include the $50,000 franchise fee and $70,000 for leasehold improvements to secure a high-traffic retail location. The model also accounts for $35,000 in IT and quoting software setup to ensure day-one readiness.
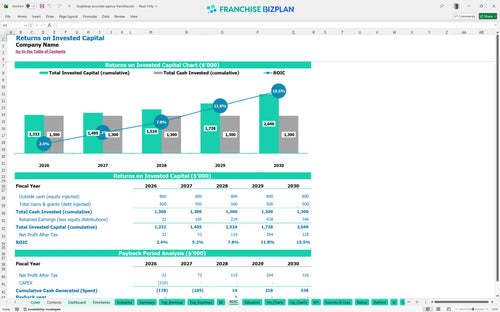
The model projects an Internal Rate of Return (IRR) of 5.59% and a Return on Equity (ROE) of 0.93. While the initial returns appear conservative, the payback period is achieved in 3 years as the renewal book of business matures. By Year 5, annual EBITDA is projected to reach $422,000, significantly enhancing the asset's resale value.
The agency hits break-even in its first month of operation, January 2026, provided the initial sales pipeline is ready. The primary driver for maintaining this is the volume of new policy commissions, which must cover the $6,800 in monthly fixed costs and the high 50% royalty burden. If policy volume dips, the high fixed salary for the Agency Principal ($90,000) becomes the primary risk factor.
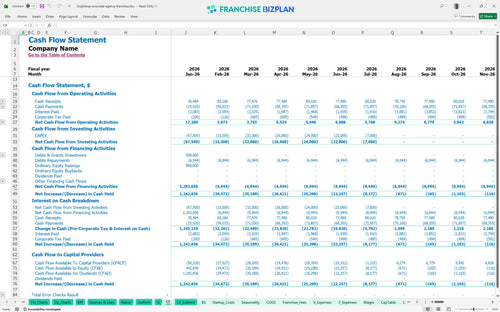
The lowest cash point is projected for December 2026 at $1.088 million, which includes the initial investment and working capital. This suggests the model assumes a significant starting cash position to weather the ramp-up phase. You should maintain a buffer to handle the timing gap between writing a policy and receiving commission payouts from carriers.
In a high-growth scenario where revenue exceeds the $925,000 Year 1 target, the 3-year payback period could shorten significantly. Conversely, a low-revenue scenario would strain the 0.93 ROE, as fixed costs like the $90,000 principal salary and $5,000 rent do not scale down. The model allows you to toggle these variables to see how a 10% drop in renewals impacts your peak cash need.
This insurance franchise financial model provides a flexible Excel environment where you can adjust every driver to fit your specific market. All formulas are unlocked, allowing you to edit assumptions for local commission splits, staffing levels, and regional rent costs without breaking the logic. Whether you are planning a single retail unit or a multi-territory rollout, the spreadsheet adapts to your specific operating scenario.

The model delivers a detailed five-year roadmap, projecting revenue to grow from $925,000 in Year 1 to over $2.1 million by Year 5. You get a full view of the income statement, balance sheet, and cash flow, ensuring you understand how renewal commissions (recurring revenue from existing policies) compound over time. This long-term perspective is vital for evaluating the true terminal value of your agency asset.

Operating within this system involves a unique 50% royalty structure, which often covers centralized back-office support and carrier access. The model tracks this significant expense alongside the 2% marketing fund contribution to show your true store-level margin. By automating these calculations, you can see exactly how much cash stays in your pocket after the franchisor takes their share of the gross commission.

Planning your entry requires a clear view of the $210,000 in estimated capital expenditures (CAPEX), including the $50,000 initial fee and $70,000 for leasehold improvements. This tool identifies your break-even sales volume, accounting for fixed costs like the $5,000 monthly rent and $6,800 in total monthly overhead. You will know exactly how many new policies are needed each month to cover your burn rate.

The model includes researched benchmarks for insurance agency operations, such as producer compensation and lead generation costs. By comparing your projected 2.5% lead spend against industry norms, you can validate if your customer acquisition strategy is realistic. These guardrails help you avoid over-hiring or under-budgeting for critical items like errors and omissions insurance or local marketing efforts.


Simply purchase and download the financial model template, then access it instantly using Microsoft Excel or Google Sheets. No installation or technical expertise required-just open and start working.

Enter your business-specific numbers, including revenue projections, costs, and investment details. The pre-built formulas will automatically calculate financial insights, saving you time and effort.

Leverage the investor-ready format to confidently showcase your financial projections to banks, franchise representatives, or investors. Impress stakeholders with clear, data-driven insights and professional reports.

Leverage the investor-ready format to confidently present your projections to banks, franchise representatives, or investors.