
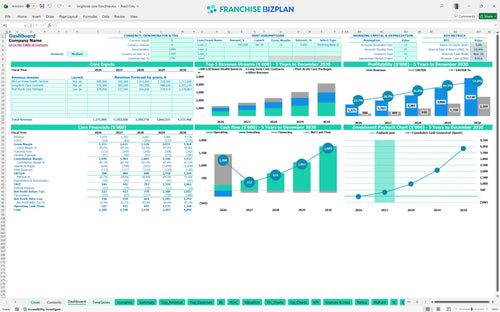
All-in-one Dashboard
Core inputs and core outputs


This comprehensive financial planning for medical staffing franchise tool includes an all-in-one Excel workbook with automated dashboards, 5-year financial statements, and detailed startup cost trackers tailored for RN-led home care.
Core inputs and core outputs
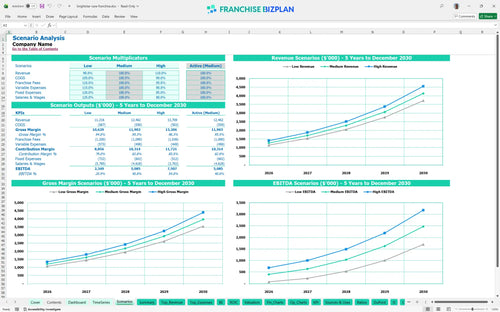
Three scenario analysis
Presentation ready
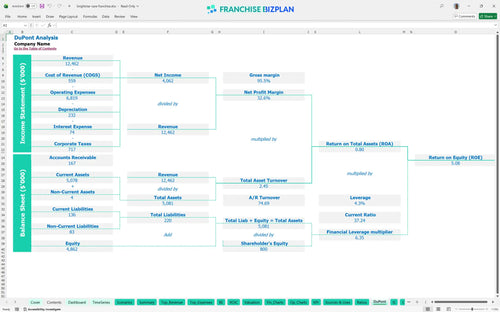
DuPont analysis
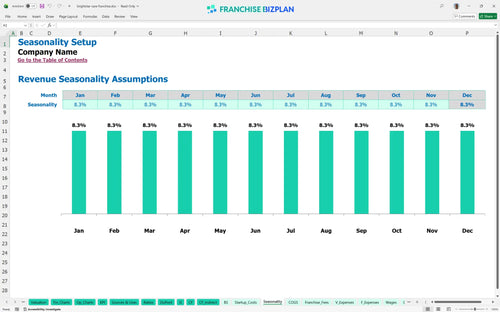
Researched revenue assumptions
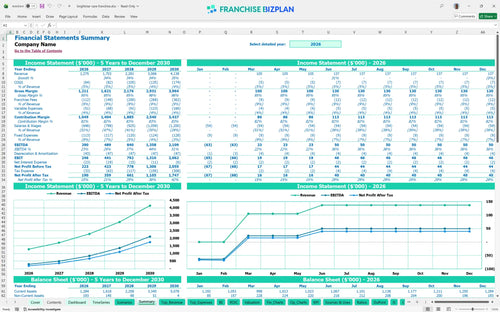
Lender-friendly financial outputs
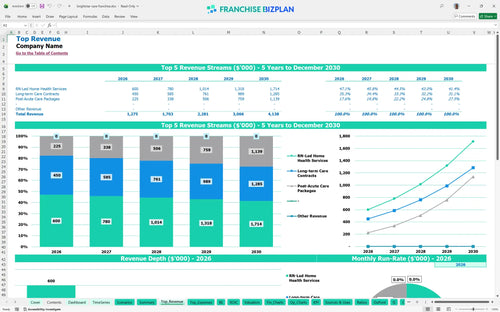
Revenue stream detailed view
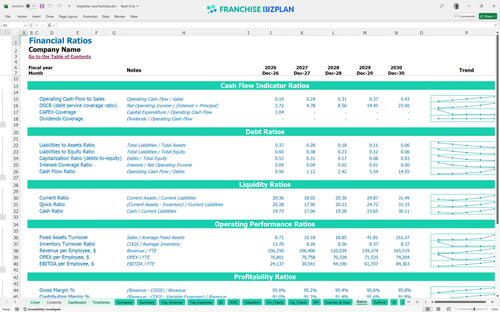
Performance metrics benchmark
We built this home health care franchise financial model using our own deep-dive research into the home care sector. Key assumptions-including revenue streams like RN-led services, operating costs for RN-led home care business units, and the 6.25% royalty-are pre-populated and fully editable. With a year-one revenue target of $1.27M and an EBITDA (earnings before interest, taxes, depreciation, and amortization) of $290k, this model provides a data-driven starting point for your investment. This is a practical tool for real-world operators, not just a theoretical exercise.
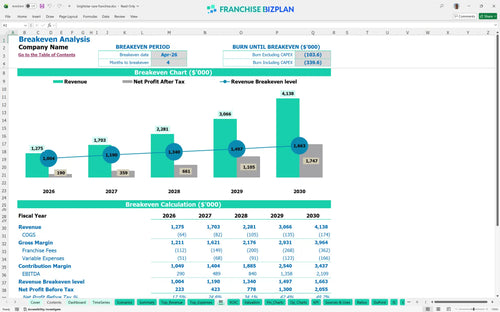
The franchise unit is projected to reach its break-even point in April 2026, just four months after launching. Profitability scales significantly by year three, with EBITDA reaching $840k as the patient census for long-term care contracts and post-acute packages matures. Early profitability depends on rapid staff deployment and clinical oversight.
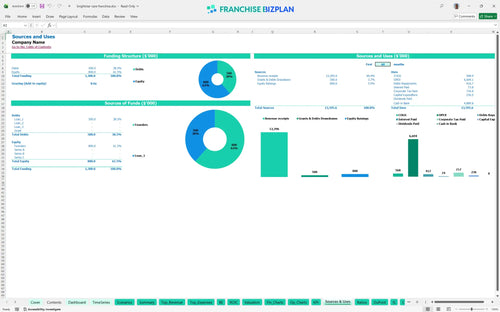
You will need a significant initial investment to cover the $50,000 franchise fee and the $55,000 for company vehicles. The total capital allocation includes $45,000 for office leasehold improvements and a $28,000 mobile technology platform setup to handle real-time family communications. Budgeting for Joint Commission accredited home care requires higher upfront quality standards. Proper capitalization ensures you survive the initial ramp-up phase.
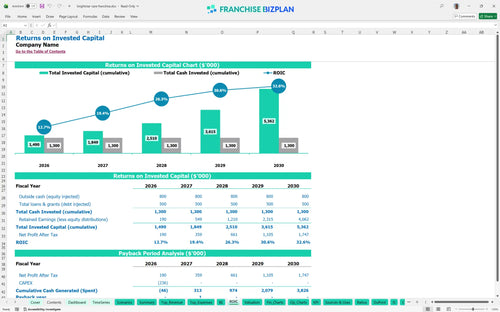
This healthcare franchise investment return calculator shows an Internal Rate of Return (IRR) of 10.39% and a 2-year payback period. While the Return on Equity (ROE) is 5.08%, the steady climb in annual revenue to $4.1M by year five suggests a strong long-term exit multiple. Home care is a volume game where margin grows with density. Your return is tied directly to local referral network strength.
The monthly break-even point is reached in month 4, provided you hit the revenue projections for private duty nursing franchise services. The primary driver for break-even is the utilization rate of your home health aides and the average ticket for post-acute care packages. If labor costs for RNs rise faster than billable rates, the break-even window will shift. Speed to break-even is about sales velocity in the first 90 days.
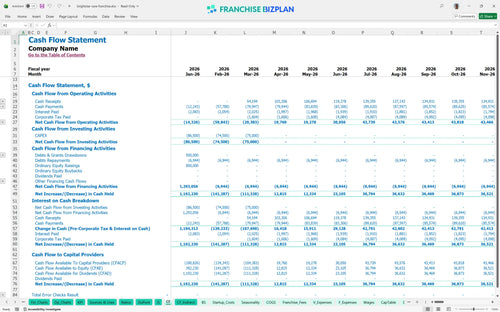
The lowest cash point occurs in March 2026, with a minimum cash balance of $940,000 required to sustain operations during the launch. You need a robust cash flow forecast for home health care agency management to navigate the gap between paying caregivers and receiving insurance or private-pay reimbursements. A six-month buffer is highly recommended to handle payroll timing. Cash is your most important clinical tool during the first year.
In a high-growth scenario, year-one revenue could exceed $1.27M if post-acute care packages launch ahead of schedule. However, a low scenario with higher-than-expected medical supply costs (currently 4.2%) or slower recruitment of RNs would drag down the 10.39% IRR. The model allows you to stress-test your home health care agency profit margin analysis against these variables. Scenarios help you prepare for the worst while aiming for the best. Execution in the field determines which scenario becomes your reality.
Finance: update unit break-even and payback model by Friday.
This home health care franchise financial model is a professional-grade Excel tool designed for total flexibility. You can adjust every formula and assumption to match your specific territory, whether you are looking at a single unit or a multi-territory expansion. It simplifies the process of creating a nursing agency business plan by providing a structure where you can plug in your own local market data. The model handles the heavy lifting of financial logic so you can focus on strategy. Customization is the key to a realistic forecast.

Planning for the long term is essential when evaluating a medical home health franchise profitability. This tool provides a detailed 5-year outlook, showing how revenue scales from $1.27M in year one to over $4.1M by year five. You get a clear view of how healthcare franchise operational expenses evolve as your patient census grows and your staff expands. It includes full profit and loss statements, cash flow forecasts, and balance sheets. A five-year view reveals the true value of the enterprise.

The model accurately tracks your ongoing obligations to the franchisor, including the 6.25% royalty and the 2.5% brand marketing fund contribution. These fees are calculated automatically based on your revenue forecasting for home care, ensuring you always know your net margin after corporate overhead. It also accounts for the initial $50,000 franchise fee as part of your startup capital. Managing these fees correctly is the difference between profit and a surprise bill. Every percentage point matters for your bottom line.

Starting a new location requires a clear understanding of how to calculate startup costs for a home health franchise. This template includes pre-set categories for your $45,000 office build-out, $55,000 in company vehicles, and $12,000 for computer systems. It calculates exactly when your monthly revenue covers both fixed and variable costs, which is projected at month 4 for this model. Knowing your break-even point helps you manage your initial cash reserves. Precision in startup budgeting prevents mid-launch funding gaps.

We have integrated industry-standard benchmarks to help you perform a franchise financial feasability study template analysis. The model includes realistic labor costs, such as a $105,000 salary for a Director of Nursing (RN) and $28,000 for home health aides, which are typical for a skilled nursing service business model. You can compare your projected gross margins against industry norms to ensure your business plan is grounded in reality. Benchmarks act as a sanity check for your most optimistic goals. Use these numbers to validate your local market assumptions.


Simply purchase and download the financial model template, then access it instantly using Microsoft Excel or Google Sheets. No installation or technical expertise required-just open and start working.

Enter your business-specific numbers, including revenue projections, costs, and investment details. The pre-built formulas will automatically calculate financial insights, saving you time and effort.

Leverage the investor-ready format to confidently showcase your financial projections to banks, franchise representatives, or investors. Impress stakeholders with clear, data-driven insights and professional reports.

Leverage the investor-ready format to confidently present your projections to banks, franchise representatives, or investors.