
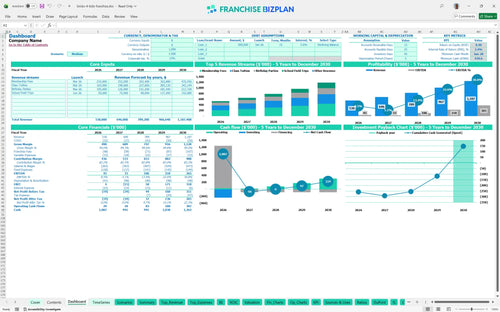
All-in-one Dashboard
Core inputs and core outputs


This franchise unit financial model template provides a detailed Excel-based framework to project revenue, manage expenses, and calculate ROI for a mobile STEM lab business or enrichment center.
Core inputs and core outputs
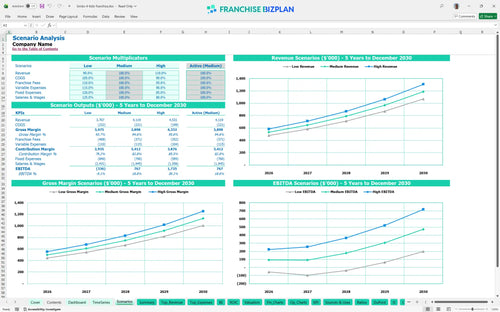
Three scenario analysis
Presentation ready
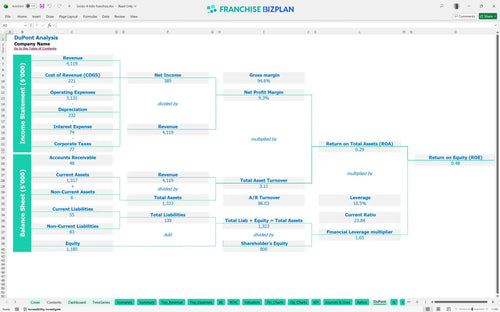
DuPont analysis
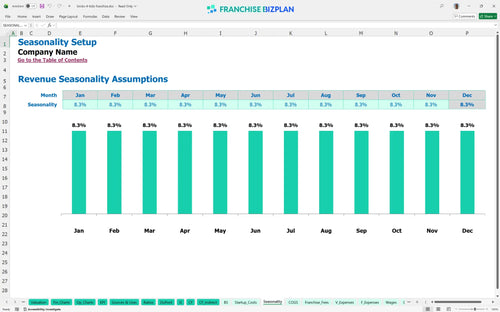
Researched revenue assumptions
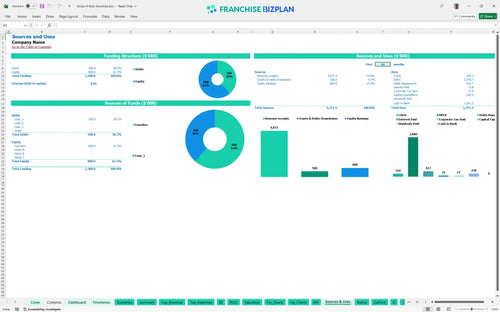
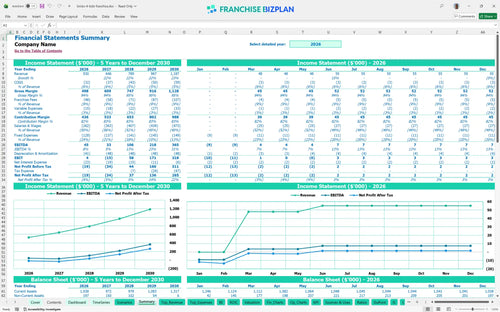
Lender-friendly financial outputs
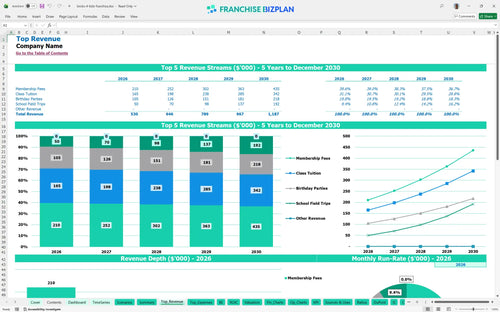
Revenue stream detailed view
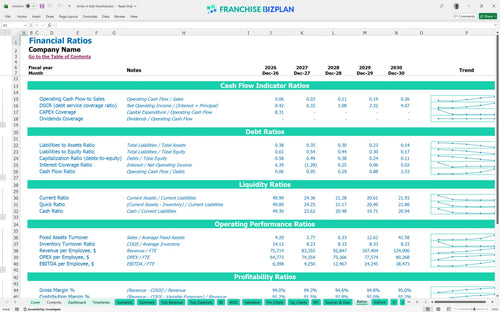
Performance metrics benchmark
We built this franchise unit financial model using our own research into the children's enrichment sector. Key assumptions like the $43,000 franchise fee and recurring revenue from membership fees are pre-populated but fully editable to match your specific territory. With a projected year-five EBITDA of $365,000, this franchise investment feasibility study template shows the potential of scaling this specific unit.
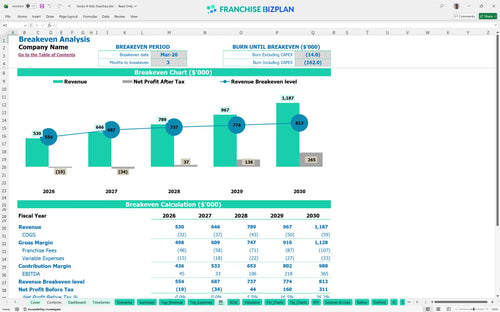
The unit hits its stride quickly, with a break-even date expected in March 2026, just three months after launch. By year three, EBITDA (earnings before interest, taxes, depreciation, and amortization) reaches $106,000 after accounting for 7% royalties and staff wages. This franchise unit profitability calculator helps you visualize the ramp-up.
You'll need significant capital to get the doors open, with the model showing a total initial investment covering $85,000 for build-out and $43,000 for the fee. The lowest cash point hits $940,000 in early 2028, suggesting you need a solid buffer for the ramp-up phase. This startup budget template for educational franchise unit covers every capital expenditure analysis detail.
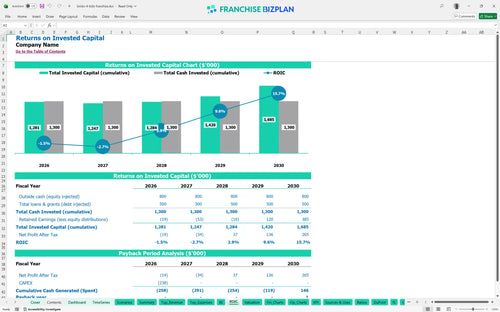
The model projects a 5-year payback period and an internal rate of return (IRR) of 2.4%. While the ROE (Return on Equity) sits at 0.48, the real value lies in the year-five cash flow as the unit matures. Calculating return on investment for franchise ownership is easier when you have financial modeling for children's activity center data at your fingertips.
Break-even occurs just 3 months in, provided you hit your $140,000 year-one membership target. The biggest drag on your break-even point is the fixed $7,500 monthly rent, so keeping throughput (the number of students moving through the center) high is critical. Analyzing recurring revenue models for kids' enrichment business is the key to faster stability.
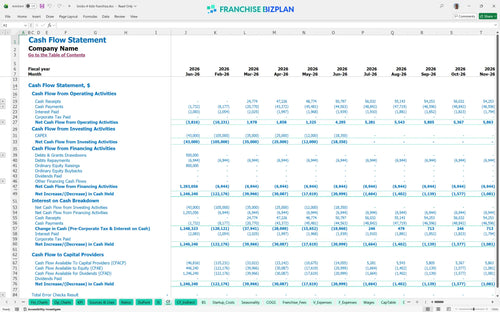
Your lowest cash point occurs in January 2028, meaning you need to manage your working capital (cash used for day-to-day operations) tightly during the second year. Even though you're profitable early, the timing of equipment upgrades like the $18,350 robotics kits can strain the bank account. Best practices for franchise unit cash flow management require careful operating expense forecasting.
A 10% drop in class tuition can delay your payback by a full year, while hitting the high case significantly boosts your year-one $45,000 EBITDA. Still, the model lets you toggle these scenarios to see how sensitive your ROI for education franchises is to local demand shifts. But remember, execution on the ground is what actually moves the needle.
Finance: update unit break-even and payback model by Friday.
This franchise financial model template is built in Excel, allowing you to tweak every assumption from student enrollment to kit costs. The pre-filled formulas handle the heavy lifting, so you can test how different pricing for birthday parties or class tuition impacts your bottom line. It's a plug-and-play tool for serious planning. This Excel template for franchise unit financial planning makes complex math simple.

We mapped out a five-year trajectory where revenue climbs from $530,000 in year one to over $1.18 million by year five. This long-term view helps you see the transition from a hands-on startup to a mature, high-volume enrichment center. You get a full look at the balance sheet and cash flow to ensure you aren't flying blind. These financial projections for after-school enrichment programs use a realistic franchise business plan Excel structure.

Operating a franchise means managing specific overhead like the 7% royalty and 2% marketing fee. This model automatically calculates these off your gross sales, ensuring you see the true store-level margin (the profit left after all direct costs). It accounts for the initial $43,000 franchise fee right at the start. Understanding the franchise royalty fee structure is vital for protecting your take-home pay.

Launching a STEM education franchise startup costs more than just the fee; you have to account for $85,000 in leasehold improvements and $35,000 for the Innovation Zone. The model identifies your break-even point-estimated at March 2026-so you know exactly when the unit stops burning cash. Honestly, knowing how to calculate startup costs for a kids' STEM franchise is the only way to survive the first year.

We defintely included benchmarks for labor and occupancy to keep your projections realistic. For example, if your mall rent of $7,500 a month eats too much of your $530,000 year-one revenue, the model will flag the margin squeeze. It's a sanity check against typical children's enrichment franchise financial projections. Use these numbers to compare your site against the national average.


Simply purchase and download the financial model template, then access it instantly using Microsoft Excel or Google Sheets. No installation or technical expertise required-just open and start working.

Enter your business-specific numbers, including revenue projections, costs, and investment details. The pre-built formulas will automatically calculate financial insights, saving you time and effort.

Leverage the investor-ready format to confidently showcase your financial projections to banks, franchise representatives, or investors. Impress stakeholders with clear, data-driven insights and professional reports.

Leverage the investor-ready format to confidently present your projections to banks, franchise representatives, or investors.