
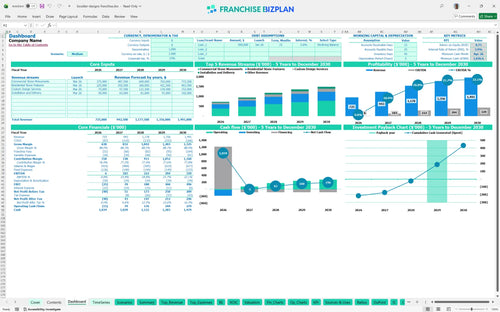
All-in-one Dashboard
Core inputs and core outputs


This franchise unit business plan includes a full suite of pro forma statements, a franchise ROI calculator, and detailed operating expense forecasting to guide your investment decision.
Core inputs and core outputs
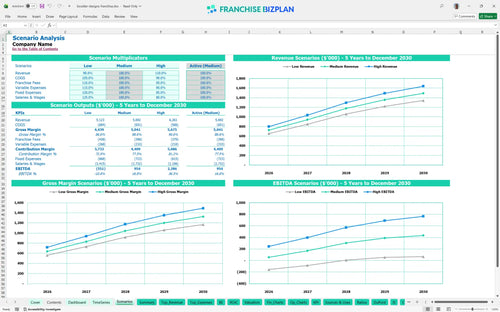
Three scenario analysis
Presentation ready
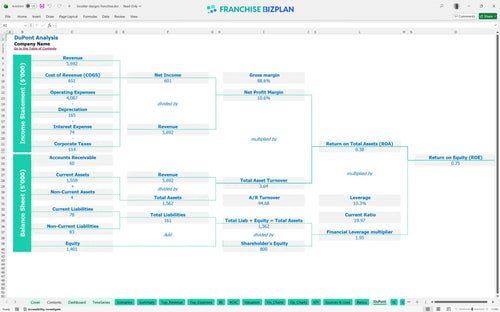
DuPont analysis
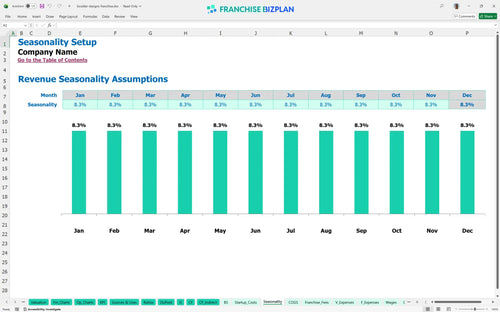
Researched revenue assumptions
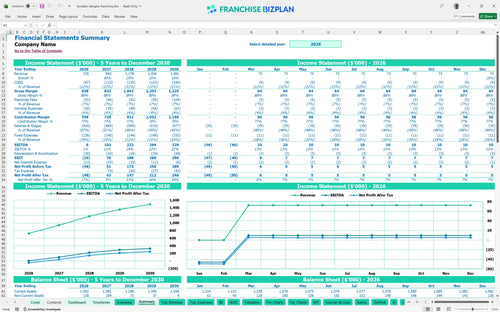
Lender-friendly financial outputs
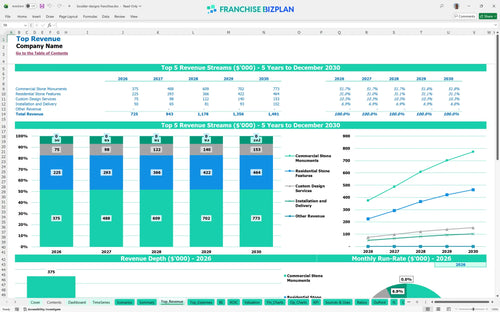
Revenue stream detailed view
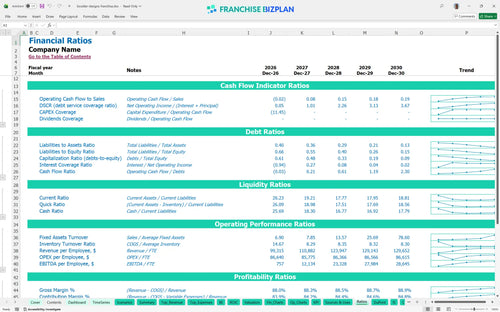
Performance metrics benchmark
We built this franchise unit financial model using our own research into the custom stone signage industry. Key assumptions like the $250,000 year-one commercial revenue and $7,000 monthly rent are pre-populated and fully editable to match your specific location. This tool provides a clear look at franchise unit economics, showing a path to $103,000 EBITDA by the second year. Data beats guessing every time.
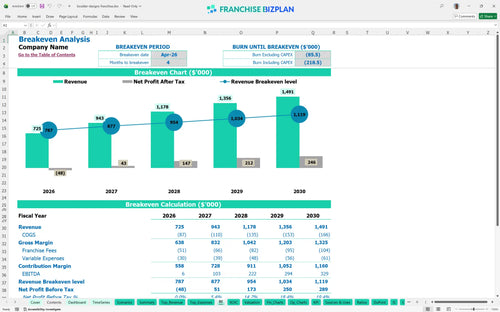
Your unit hits the break-even point in April 2026, just four months after launching. While year one is lean with only $6,000 in EBITDA, this profit and loss template for individual franchise units shows profit scaling quickly as residential stone features and commercial monuments gain local traction. Profitability takes time but scales fast.
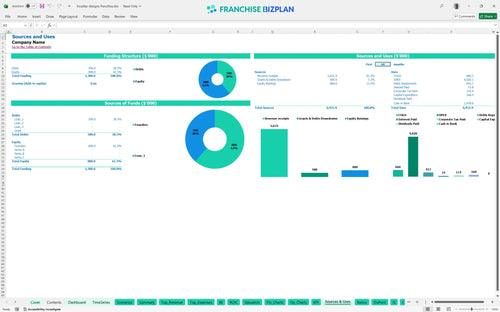
You need roughly $168,000 in capital to cover the $63,000 franchise fee, $35,000 in leasehold improvements, and $30,000 for specialized stone crafting equipment. This financial planning spreadsheet for new franchise operators also accounts for a delivery truck and studio setup. Know where every dollar goes.
The model projects a 4-year payback period and an IRR of 3.85%, which is a conservative start for a custom construction franchise. Here is the quick math: with a 0.75 ROE, you are playing a long game focused on asset value and steady cash flow. Focus on the long-term equity.
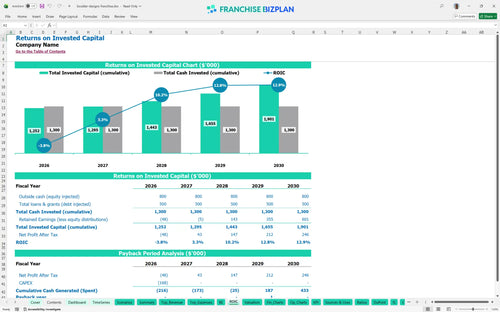
To cover your $11,350 in monthly fixed costs-defintely driven by that $7,000 prime location rent-you need to move a consistent volume of stone monuments. Estimating ROI for a new retail franchise location depends heavily on hitting these volume targets by month four. Volume is your best friend.
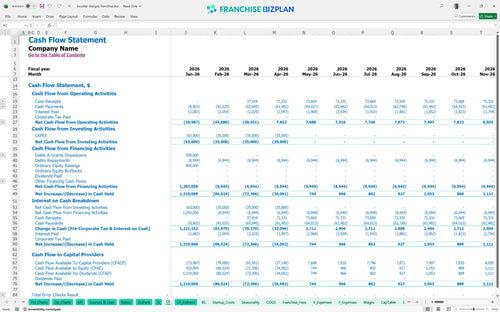
Your lowest cash point occurs in April 2026, coinciding with your break-even month. This franchise unit cash flow projection example suggests you will need a minimum cash buffer of $1,027,000 to handle the initial ramp-up and equipment heavy-lifting. Keep a tight grip on the checkbook.
Moving to a high-growth scenario can push your year-5 revenue past $1.49 million. Understanding franchise royalty and marketing fund overhead is easier when you see how a 10% revenue drop in a low case impacts your ability to cover the fixed $72,000 GM salary. Plan for the best, prepare for the rest.
Finance: update unit break-even and payback model by Friday.
This franchise financial model template lives in Excel, giving you total control over every variable from local rent to specific labor rates. You can swap out pre-filled data for your own local market reality, making it a versitile small business franchise model for any territory. Every cell is open for your input.

Planning for the long haul is easier when you can see how revenue climbs from $725,000 in year one to nearly $1.5 million by year five. This franchise financial projections excel tool maps out your growth trajectory and includes a detailed franchise profitability analysis. Growth is a marathon, not a sprint.

Understanding the royalty fee structure is vital because that 7% top-line hit happens every single month regardless of your margin. We have baked in the $63,000 initial fee and ongoing obligations so you can see exactly how much cash stays in your pocket after the franchisor gets paid. Royalties are the price of the system.

Use this as your franchise startup cost calculator to track the $168,000 needed for equipment, leaseholds, and that initial fee. Knowing how to calculate startup costs for a signage franchise helps you manage your burn rate during those critical first four months. Cash is king during the build-out.

This is a specialized franchise financial model template for service-based businesses that incorporates stone material and labor benchmarks. It helps you sanity-check if your 9.5% material cost is on track while budgeting for franchise specialized equipment and installation labor. Compare your numbers to the pros.


Simply purchase and download the financial model template, then access it instantly using Microsoft Excel or Google Sheets. No installation or technical expertise required-just open and start working.

Enter your business-specific numbers, including revenue projections, costs, and investment details. The pre-built formulas will automatically calculate financial insights, saving you time and effort.

Leverage the investor-ready format to confidently showcase your financial projections to banks, franchise representatives, or investors. Impress stakeholders with clear, data-driven insights and professional reports.

Leverage the investor-ready format to confidently present your projections to banks, franchise representatives, or investors.