
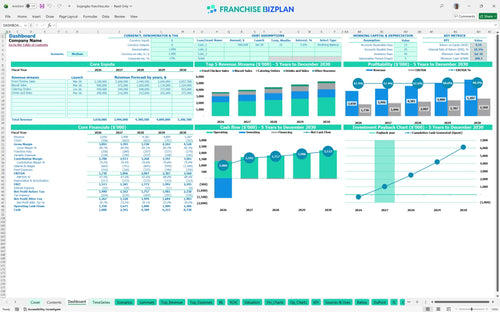
All-in-one Dashboard
Core inputs and core outputs


This franchise unit profitability analysis tool provides a complete roadmap from initial build-out to a mature, cash-flowing five-year operation.
Core inputs and core outputs
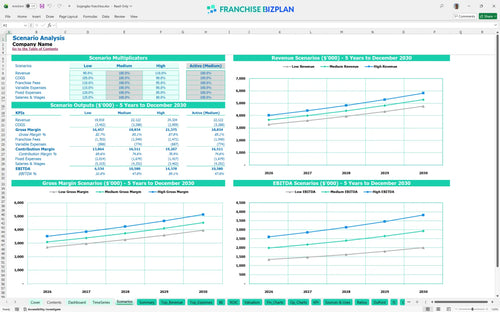
Three scenario analysis
Presentation ready
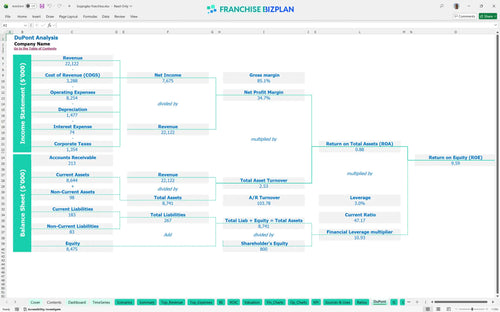
DuPont analysis
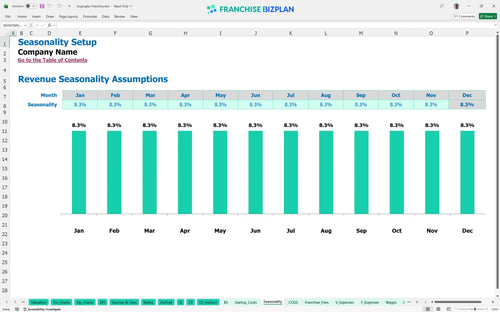
Researched revenue assumptions
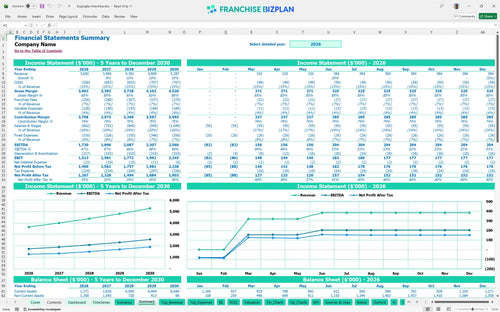
Lender-friendly financial outputs
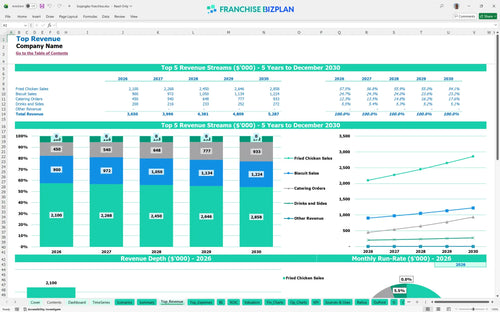
Revenue stream detailed view
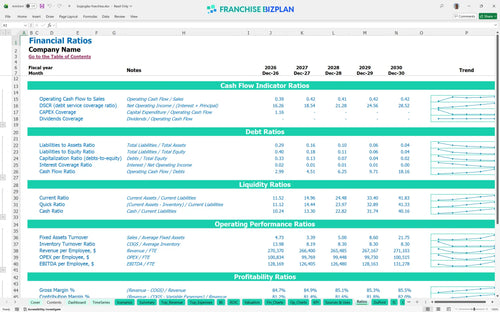
Performance metrics benchmark
We built this franchise unit financial model using our own research into the quick-service sector. Key assumptions like the $1.4M fried chicken sales and $1.73M year-one EBITDA (earnings before interest, taxes, depreciation, and amortization) are pre-populated and fully editable. This financial model for multi-channel catering business also includes specific drivers for mobile orders and drive-thru volume.
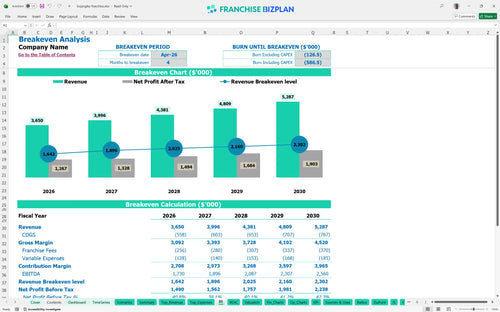
The unit reaches profitability quickly, hitting its break-even point in April 2026, just four months after opening. By year two, EBITDA is projected at $1.89M, driven by predicting profit margins for quick service restaurants through tighter food cost management. Speed to profit is the ultimate franchise metric.
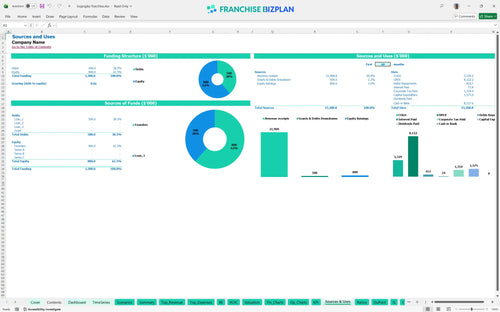
Launching this unit requires a total initial investment of $1,575,000, which includes the $35,000 franchise fee and $600,000 for leasehold improvements. This startup budget template for retail franchise location also accounts for $400,000 in kitchen equipment and $200,000 for drive-thru infrastructure. Every dollar spent on build-out must earn its keep.
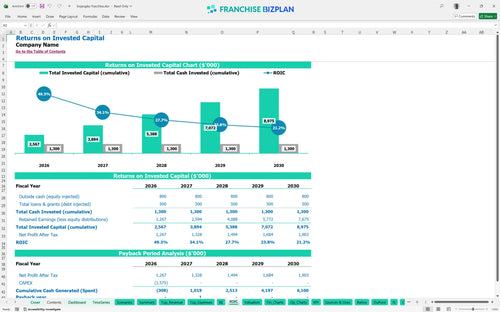
Investors can expect an Internal Rate of Return (IRR) of 10.28% and a Return on Equity (ROE) of 9.59%, with a full payback achieved in 2 years. This restaurant franchise investment return calculator shows that with $3.65M in year-one sales, the unit generates enough cash to support growth early. A two-year payback is a strong signal for multi-unit growth.
The unit hits its monthly break-even point in month 4, requiring enough volume to cover $18,000 in rent and $31,350 in monthly manager and supervisor salaries. Analyzing break-even point for new franchise units reveals that drive-thru throughput is the primary driver for covering fixed costs. Break-even is a race against your fixed costs.
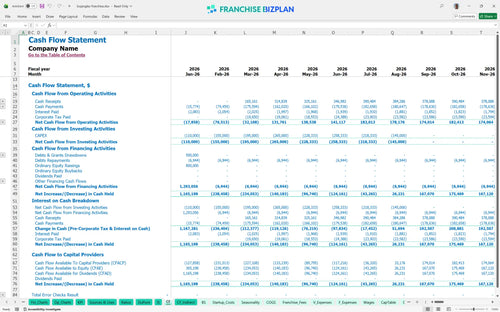
Your lowest cash point occurs in July 2026 at $288,000, meaning you need a solid capital buffer to handle the initial ramp-up. Operating expense forecasting suggests that managing the timing of your $1,575,000 CAPEX (capital expenditure) is defintely critical to maintaining liquidity. Cash is oxygen; don't let your growth suffocate it.
In the high scenario, hitting $5.28M in sales by year 5 pushes EBITDA to $2.56M, while the low scenario might extend your payback period beyond 3 years. This financial feasibility study for fast food franchise shows that a 2% shift in food costs or labor can impact your peak cash needs. Scenarios turn guesses into a battle plan.
This Excel-based tool lets you swap out every variable, from drive-thru traffic counts to local labor rates. We built it so you can test different 'what-if' scenarios without breaking the math, making it a reliable QSR business plan template for your specific territory. It's about making the math work before you sign the lease.

Mapping out the next 60 months is critical for securing lending and managing multi-unit growth. This model provides detailed fast food franchise financial projections, showing how revenue scales from $3.65M in year one to over $5.28M by year five. Five years of foresight prevents fifty months of headaches.

Operating a brand means paying for the system, and those costs hit the top line every single month. This model tracks the 4% royalty and 3% marketing fund contributions automatically against your gross sales so you can see the impact on store-level margin. Brand power isn't free, so track every royalty dollar realy closely.

Knowing how to calculate startup costs for a restaurant franchise is the first step to avoiding a cash crunch. We've mapped out the $1,575,000 initial investment, covering everything from the $35,000 franchise fee to the $600,000 leasehold improvements. Knowing your number is the only way to sleep at night.

Don't guess on your food costs or labor percentages; use the built-in benchmarks to stay competitive. The model includes typical QSR revenue modeling data, like food ingredients starting at 13.8% of sales and labor scaling with your shift supervisors and line cooks. Benchmarks are the guardrails for your bank account.


Simply purchase and download the financial model template, then access it instantly using Microsoft Excel or Google Sheets. No installation or technical expertise required-just open and start working.

Enter your business-specific numbers, including revenue projections, costs, and investment details. The pre-built formulas will automatically calculate financial insights, saving you time and effort.

Leverage the investor-ready format to confidently showcase your financial projections to banks, franchise representatives, or investors. Impress stakeholders with clear, data-driven insights and professional reports.

Leverage the investor-ready format to confidently present your projections to banks, franchise representatives, or investors.