
All-in-one Dashboard
Core inputs and core outputs


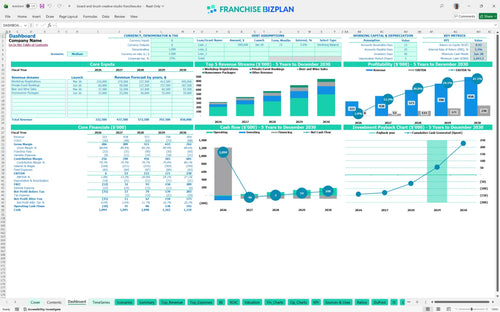
This franchise unit financial model for retail and service provides a complete toolkit for analyzing revenue streams, operating expenses, and capital requirements over a sixty-month period.
Core inputs and core outputs
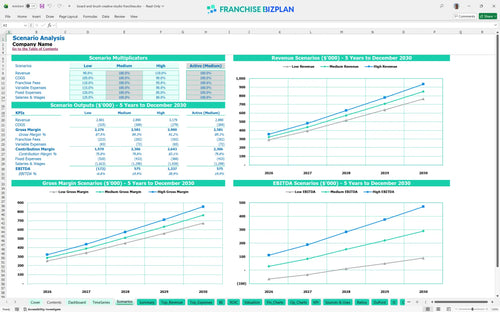
Three scenario analysis
Presentation ready
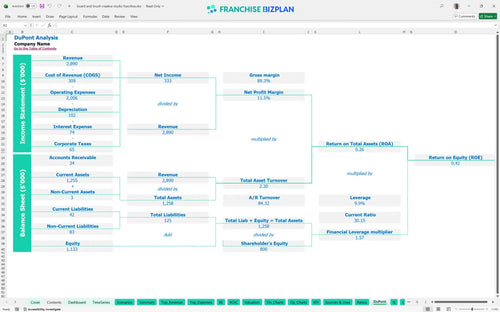
DuPont analysis
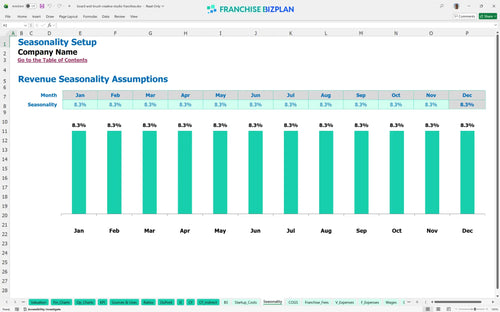
Researched revenue assumptions
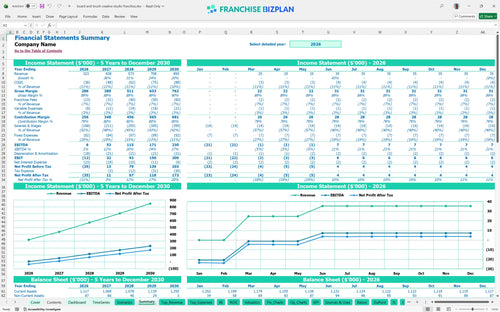
Lender-friendly financial outputs
Revenue stream detailed view
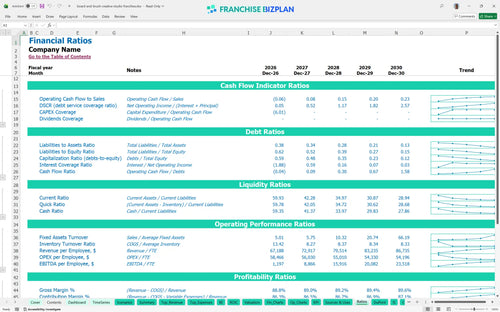
Performance metrics benchmark
We developed this Board & Brush Creative Studio Franchise unit financial model using detailed research into the DIY workshop space and specific brand requirements. Key assumptions, including $323,000 in first-year revenue and a 6% royalty structure, are pre-populated and fully editable to match your local market reality. This tool provides a data-driven foundation for estimating labor costs for boutique retail franchise operations and tracking store-level EBITDA.
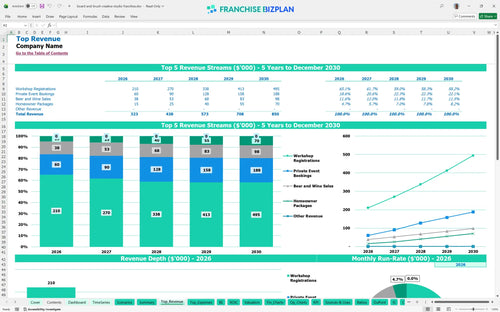
The studio reaches store-level profitability in its first year, generating $6,000 in EBITDA, and scales to $230,000 by year five. This trajectory assumes workshop registrations grow from $140,000 to $330,000 as local brand awareness and repeat demand increase over time.
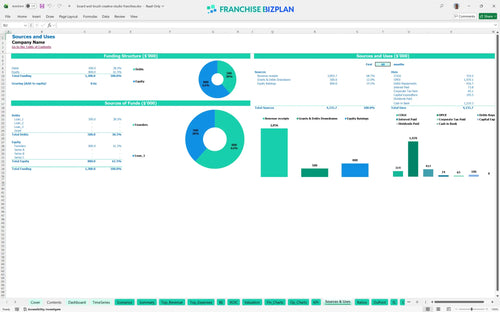
You need $105,500 in total capital to cover the initial franchise fee, build-out, and opening inventory. This budget includes $20,000 for leasehold improvements and $15,000 for workshop tools to ensure the studio meets brand standards from day one.
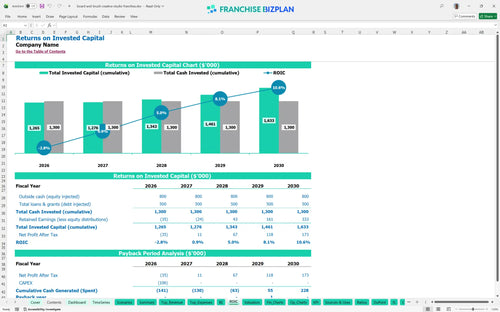
Investors can expect a 3.3% Internal Rate of Return (IRR) and a full payback of the initial investment within 4 years. The model shows a Return on Equity (ROE) of 0.42, reflecting the steady ramp-up of the DIY studio's diverse revenue streams.
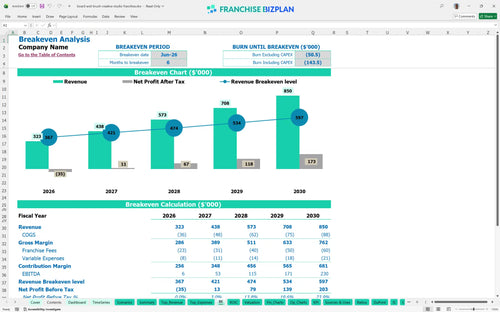
The unit reaches break-even in June 2026, just six months after launching, provided it hits its early workshop registration targets. The primary driver for break-even is maintaining high throughput during peak weekend sessions to cover the $4,200 monthly rent.
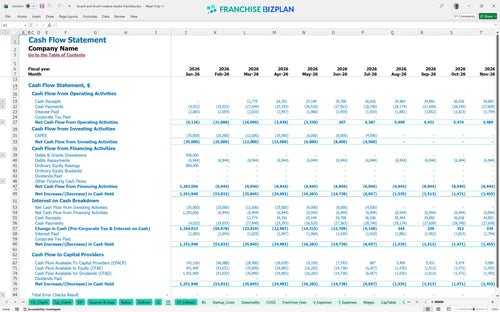
The lowest cash point occurs in January 2028, but the model maintains a significant buffer with $1,043,000 in minimum cash. You will defintely need to monitor working capital during the first six months to manage the gap between opening expenses and mature workshop volume.
A high-performance scenario driven by strong private event bookings can significantly pull forward the 4-year payback period. Conversely, a low-revenue scenario where workshop registrations lag will increase the peak cash need and compress the year-1 EBITDA margin below $6,000.
This franchise unit financial model is built in Excel with fully editable assumptions and pre-filled formulas, allowing you to adapt the projections to any specific territory or market condition. You can adjust every driver from workshop pricing to local labor rates to see how they impact your bottom line in real-time.

Plan for long-term growth with a detailed 5-year outlook that tracks revenue, expenses, and cash flow as your studio matures. This retail franchise business plan tool helps you visualize the transition from a single-unit startup to a stable, cash-flowing operation with a clear view of your future balance sheet.

The model accurately handles your ongoing financial obligations, including the 6% royalty fee and 1% marketing fund contribution based on gross sales. By automating these calculations, you can see exactly how much of your $55 average ticket goes to the franchisor and what remains for store-level margins.

Estimate your total initial investment and identify the exact moment your studio starts covering its own costs. This franchise startup costs spreadsheet breaks down everything from the $25,000 initial fee to leasehold improvements, giving you a precise target for monthly workshop volume.

Compare your projections against standard unit economics to ensure your labor and occupancy costs stay within healthy ranges. The model includes benchmarks for DIY workshop franchise operations, helping you sanity-check your $4,200 monthly rent and instructor staffing levels against industry norms.


Simply purchase and download the financial model template, then access it instantly using Microsoft Excel or Google Sheets. No installation or technical expertise required-just open and start working.

Enter your business-specific numbers, including revenue projections, costs, and investment details. The pre-built formulas will automatically calculate financial insights, saving you time and effort.

Leverage the investor-ready format to confidently showcase your financial projections to banks, franchise representatives, or investors. Impress stakeholders with clear, data-driven insights and professional reports.

Leverage the investor-ready format to confidently present your projections to banks, franchise representatives, or investors.